Models and reality
What is a hypothesis?
Distance sampling, as with all forms of scientific enquiry, relies on the concept of hypotheses and models
A Hypothesis is a possible explanation for something we observe
For example, we notice there is variation in butterfly abundance across the landscape. One hypothesis to explain this might be:
- Butterflies 🦋 are more abundant where their caterpillar 🐛 food plants 🌿 thrive
An alternative hypothesis could be:
- Butterflies 🦋 are more abundant in areas with fewer predators 🐦
We also have a null hypothesis, for example that our perception of butterflies is mistaken, and their abundance doesn’t actually vary across the landscape
- Butterfly 🦋 abundance does not vary across the landscape
What is a model?
A model is a mathematical representation of a hypothesis about the real world
A model tries to explain the patterns we see by relating response variables to predictor variables in a mathematical formula
| Hypothesis | Parameters | Model |
|---|---|---|
| Butterfly abundance increases with caterpillar food abundance | 🌿 | \(Abundance \propto Food\) |
| Butterfly abundance decreases with predator density | 🐦 | \(Abundance \propto \frac{1}{Predators}\) |
| Butterfly abundance is stable across the landscape | \(Abundance \propto 1\) |
No models are the truth
We can never find the one “true” model which represents the full complexity of an ecological system
It is impossible to measure all the ecological variables and how they interact!
All models are merely approximations of reality, and often represent reality in a very simplified way
Information Theory explicitly recognises that there is no one true model, and instead focusses on model selection and drawing inferences from multiple models
We compare our candidate models and weigh up the evidence for each, placing them in rank order based on how likely they are given the data:
- 🦋 \(\propto\) 🐦
- 🦋 \(\propto\) 🌿
- 🦋 \(\propto\) 1️⃣
We want to find out how strong the effect of a parameter is, and the direction of that effect, rather than trying to explain bit of variation in our data
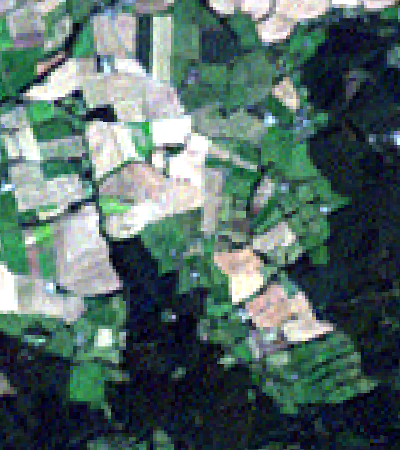
Models are like maps
A model’s simplification of the real world is like a route map:
The real world (Landsat)
Simplified model (OpenStreetMap)
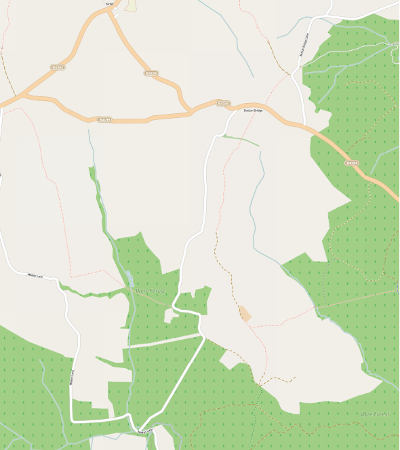
The map is a deliberate simplification, showing only roads, forest and streams
We lose detail (noise), but it’s easier to see travel routes, and contrast forest with agricultural land (the information) - we have an adequate model of reality
What is a good model?
“All models are wrong, but some are useful” - Box (1976)
Our raw data contain:
- Useful information - the dominant patterns we are trying to model, and
- Noise - residual, un-modelled data, such as interactions between factors, rare events
We don’t want our model to describe our particular set of survey data with all its idiosyncratic detail
A good model:
- Adequately describes the information, without modelling the noise
- Has strong predictive ability and high precision (small standard errors)
Whether any of our models are “good" depends primarily on the quality of the science and a priori thinking that went into devising our hypotheses
How complex should models be?
We could make correct predictions from a complex non-linear model with many variables
However, understanding the main dynamics of a system is easier with a simple model
The results from a simple model may be inexact because of uncertainty in model selection, and inflated error terms for our parameter estimates
However, we tolerate some loss in precision to gain a simpler and more useful understanding of what drives the patterns in our field studies
Number of parameters
With limited sample size (common in conservation), our field data only contain a small amount of information, and we can only estimate a few parameters
More complex models require more data, so you need to collect sufficient field data to test your preferred set of parameters
The data are trying to talk to us, but some signals are stronger than others
- Carefully selecting initial hypotheses means we can pick out the strongest signals
- Weak signals may be detected but will be difficult to interpret
- More data could make weak signals strong enough to read, so we can test more highly-parameterised models
Sample size
Parameters = sample size / 10
Anderson (2008, p32) recommends as a rule of thumb that you can estimate one parameter for every ten data points
Remember that your models always include:
- An intercept
- A coefficient for each continuous variable
- A mean for each category1
Remember that in distance sampling, our sample size is the number of different transect locations we survey