Import covariates

Load packages automatically

So far we have reloaded here and unmarked manually each time you open your project

Instead, we can create an .RProfile1 file, and place library() commands within it so RStudio loads required packages automatically 💪

Run this code in the Console to create a new text file in your top-level project directory:

file.edit(".Rprofile") # Open a blank script to edit

Copy-paste these two lines into your new file:

library(here)
library(unmarked)

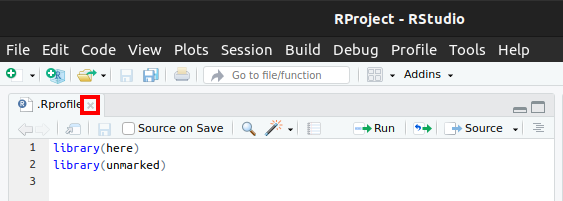
Save and close the script tab using the little cross just to the right of the tab name .Rprofile:
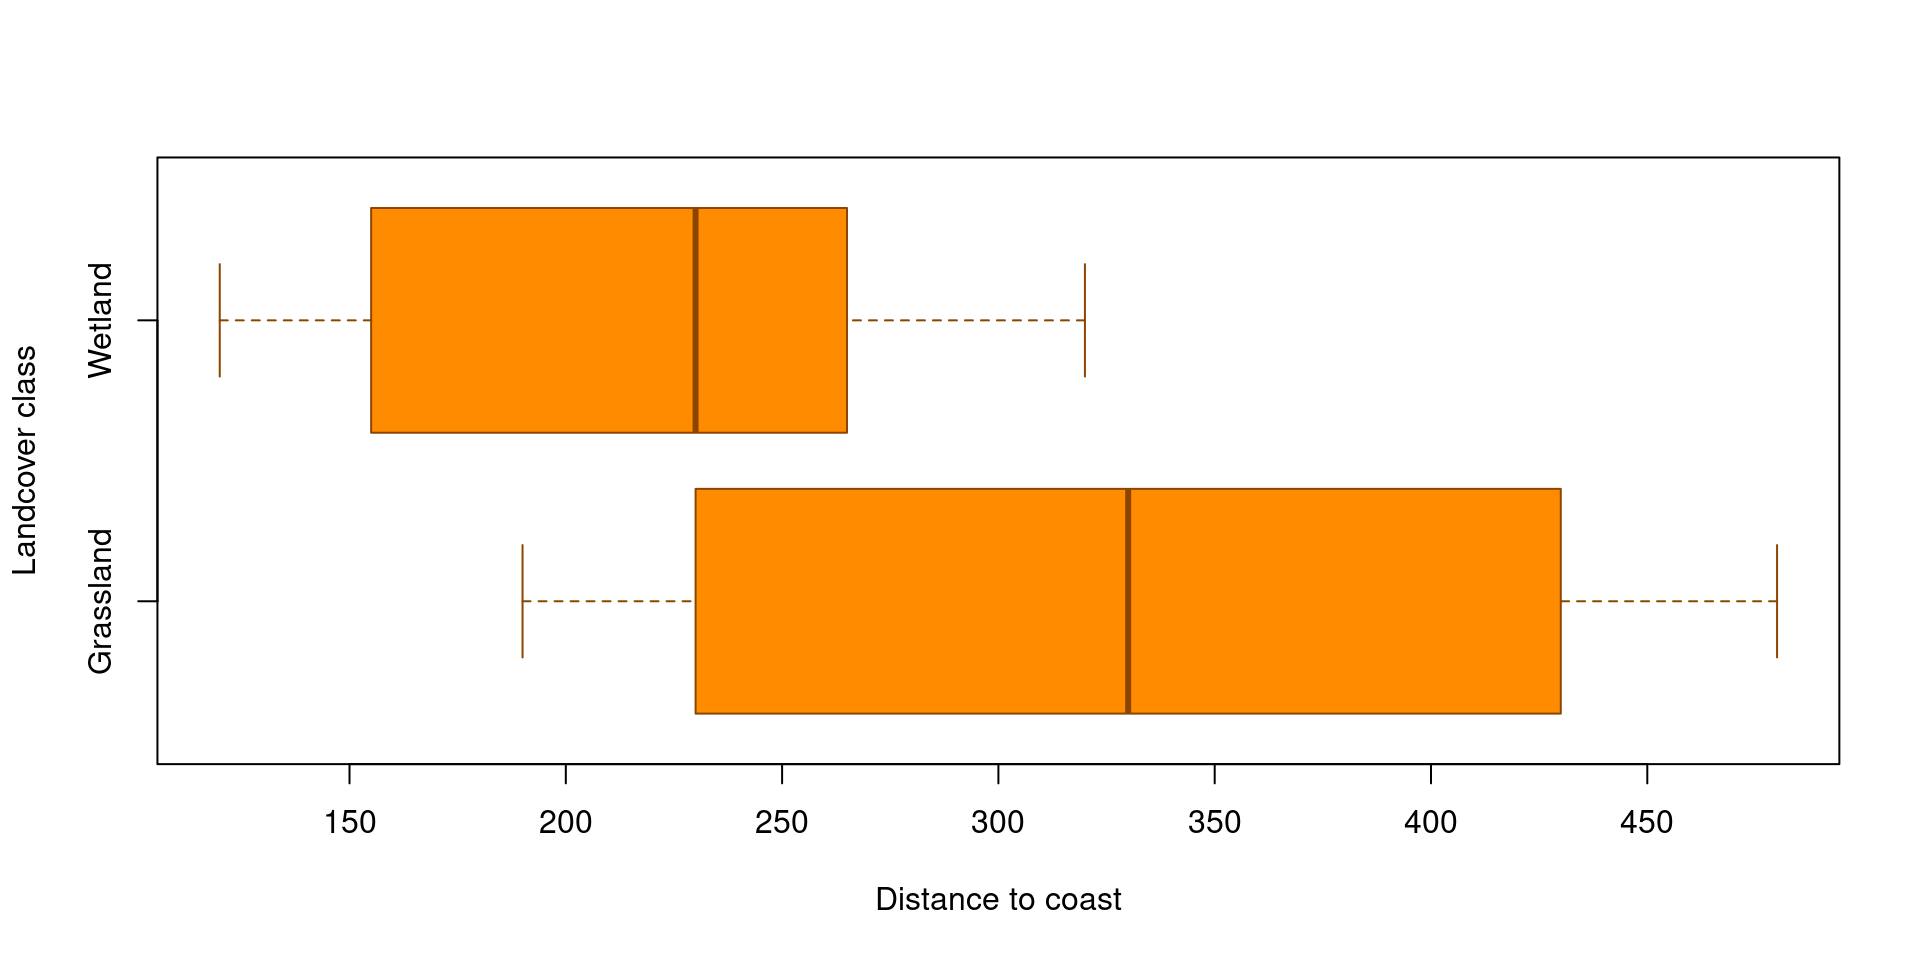
Screenshot of RStudio with Close script button highlighted in red

Import covariate data

Let’s use read.table() to import the environmental data collected during the water deer surveys

Where did you save Covariates.csv?

Make sure that you provide the appropriate subdirectory name to here(), so R looks in the right folder for the Covariates.csv you downloaded above

Covs <- read.table(here("data/raw_data", "Covariates.csv"), header = TRUE, sep = ",")

Case-study covariates

The water deer covariate data include three variables:

  1. Landcover: The landcover class which the transect passes through. There were two landcover classes
    1. Grassland: Open grazed grassland with relatively short vegetation
    2. Wetland: More densely-vegetated tall reed beds, with some patches of open water
  2. Team: Identity of the pair of observers who surveyed each transect: A or B
  3. DistToCoast: Distance from the transect to the coast, in metres

Which covariates could affect density, and which detectability?

Examine the covariates

Use R functions such as str() and summary() to examine the data numerically:

  • What measurement scale do they use? Has R identified this correctly?

Examine the data visually:

  • Make histograms of individual continuous variables to see their distribution
  • If you have multiple continuous variables, create scatterplots to assess colinearity
  • Create boxplots to check whether the distribution of a continuous variable differs between categories of a nominal or ordinal variable

If you’re unsure how to create or interpret plots and descriptive statistics, post in our private discussion area with the tag help-needed

Understand your data!

It’s vital to understand the field data that you’re working with, so that you can more easily interpret the results of statistical tests, and identify or avoid problems during analysis 😅

Example descriptive statistics

[1] "TransectID"  "Landcover"   "Team"        "DistToCoast"
summary(Covs)
  TransectID            Landcover Team   DistToCoast   
 Length:12          Grassland:5   A:6   Min.   :120.0  
 Class :character   Wetland  :7   B:6   1st Qu.:182.5  
 Mode  :character                       Median :245.0  
                                        Mean   :264.2  
                                        3rd Qu.:322.5  
                                        Max.   :480.0  

Example plot

boxplot(Covs$DistToCoast ~ Covs$Landcover, horizontal = TRUE, 
  xlab = "Distance to coast", ylab = "Landcover class", 
  col = "darkorange", border = "darkorange4")