Contents
Import your own field data
You may need to work on your own field data before they are ready for QGIS. These instructions assume that you’re working with vector data, and that your observations are associated with point locations. If you need to create lines (e.g. transects) or polygons (e.g. management areas or veg plots), you can do this from point data, or you may be working with tracks saved in your GPS. If you can’t figure out how to work with your data, post in the community forum, tagging your new topic with help-needed
![]() You can store survey locations and detailed observation data (attributes) in two separate files, and add them to QGIS and combine them in separate stages based on a matching field such as Waypoint ID. However, for beginners we recommend that the coordinates and survey information are combined into a single file for simplicity
You can store survey locations and detailed observation data (attributes) in two separate files, and add them to QGIS and combine them in separate stages based on a matching field such as Waypoint ID. However, for beginners we recommend that the coordinates and survey information are combined into a single file for simplicity
Check your data for errors & consistency
Before adding your field observations to QGIS, you need to ensure they are clean and consistent. A good way to check for problems is to open your data in Excel and use the Filter or Pivot Table tools to examine them
- If you have data from multiple surveys in different sheets of the same Excel file, and they have identical columns, combine your data into a single sheet. This makes the following checks easier, and you can divide them back into separate layers in QGIS later, if necessary
- Do you have missing observations, and are they indicated in the same way throughout the dataset? QGIS can cope with empty cells, but you can also use a specific code such as NoData or -999
- Check that categorical
 data are consistent i.e. species/site names or vegetation types are always spelled the same way. Do you have the correct number of categories?
 - Check that quantitative
 data make sense. Try sorting the data, or filtering to show the 10 highest/lowest values. Are there any extreme values (much lower or higher than expected) which might indicate a misplaced decimal point or typing error?
 - Check that dates
 and times
  are recorded in a standardised fashion e.g. yyyy-mm-dd, or hh:mm
 - Check that you know which SRS your location coordinates
 use. Can you distinguish whether they are Latitude-Longitude, a projected SRS such as a UTM zone, or other national coordinate system? We will cover SRSs in more detail in module 3, but if you want to add your field data to QGIS at this stage, you need to know their SRS. Look in your GPS to see what SRS was used when collecting the waypoints, or talk to your field colleagues if you’re not sure
 - Check that all locations are stored using the same SRS. If not, you will need to split your data into a separate file for each SRS, re-project them in QGIS so that they all use the same SRS, and then merge them
- Save your work before proceeding to the next step!
Save your data as a text file
Now your data are clean, consistent, and in a single file where possible, you can export them into a format that QGIS can read
Note that saving your Excel spreadsheet as a text file will only save the active sheet, so make sure you have saved your cleaned data as an Excel spreadsheet before this step
- Save your Excel spreadsheet as a .txt or .csv file, (not the usual .xls or .xlsx)
Import your data to QGIS
Now your data are ready to import into QGIS! To add the text file to your GIS project, you’ll need to use a new method. QGIS won’t automatically know where to draw data in .csv or .txt format, so we have to tell it where the location coordinates are stored
For those of you who are more confident with the basics of using QGIS, here are the steps without screenshots:
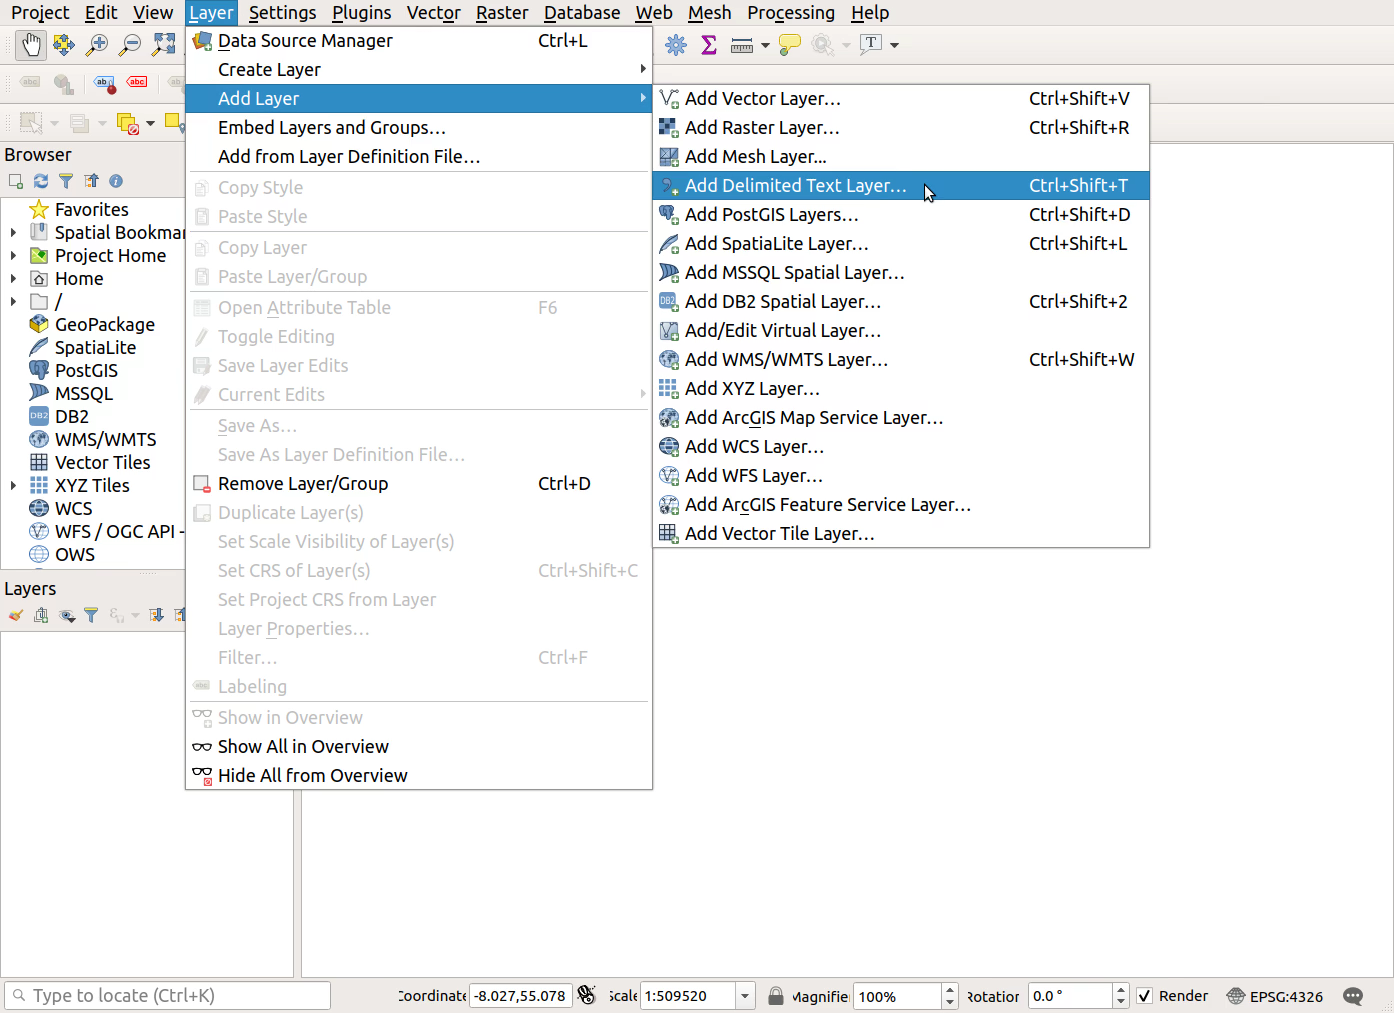
Layer > Add Layer > Add Delimited Text Layer...- Choose source file - click the
...button and find your text file- Ensure
Point coordinatesis selected underGeometry Definition- Provided your location columns are labelled as X and Y or Latitude and Longitude, QGIS should automatically recognise that they are where the coordinates are stored. If you have used different column names, you will need to select the correct columns now
- Click
AddandClose
For those of you who want more detail or visual instructions, here are the steps including screenshots:
![]() Be aware that the csv file in these screenshots is different from yours!
Be aware that the csv file in these screenshots is different from yours!
Layer > Add Layer > Add Delimited Text Layer...

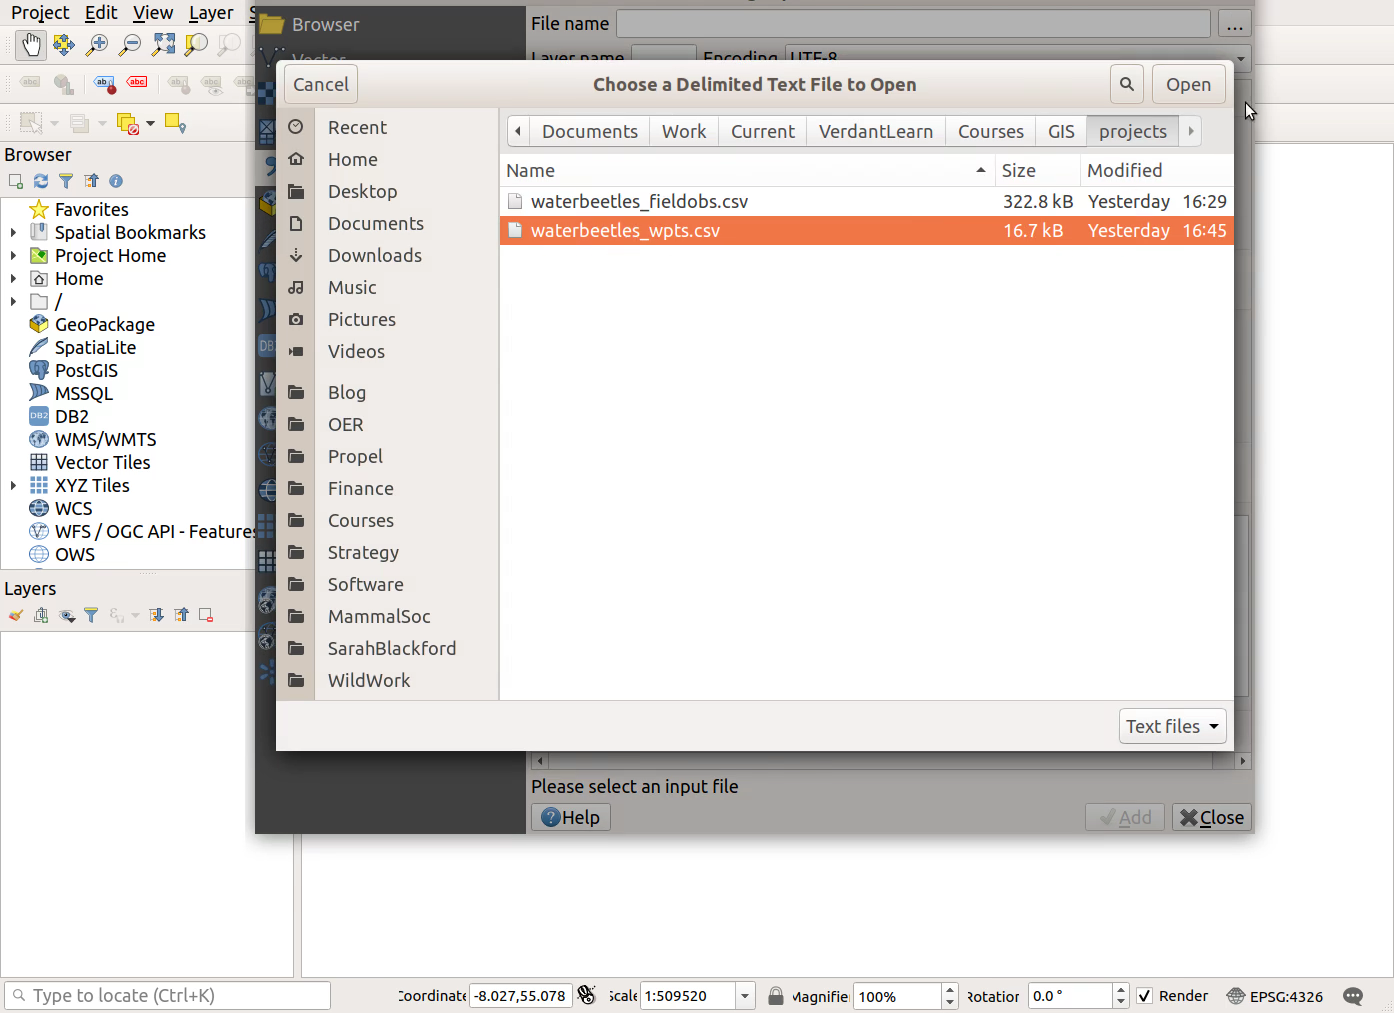
- Choose source file - click the
...button

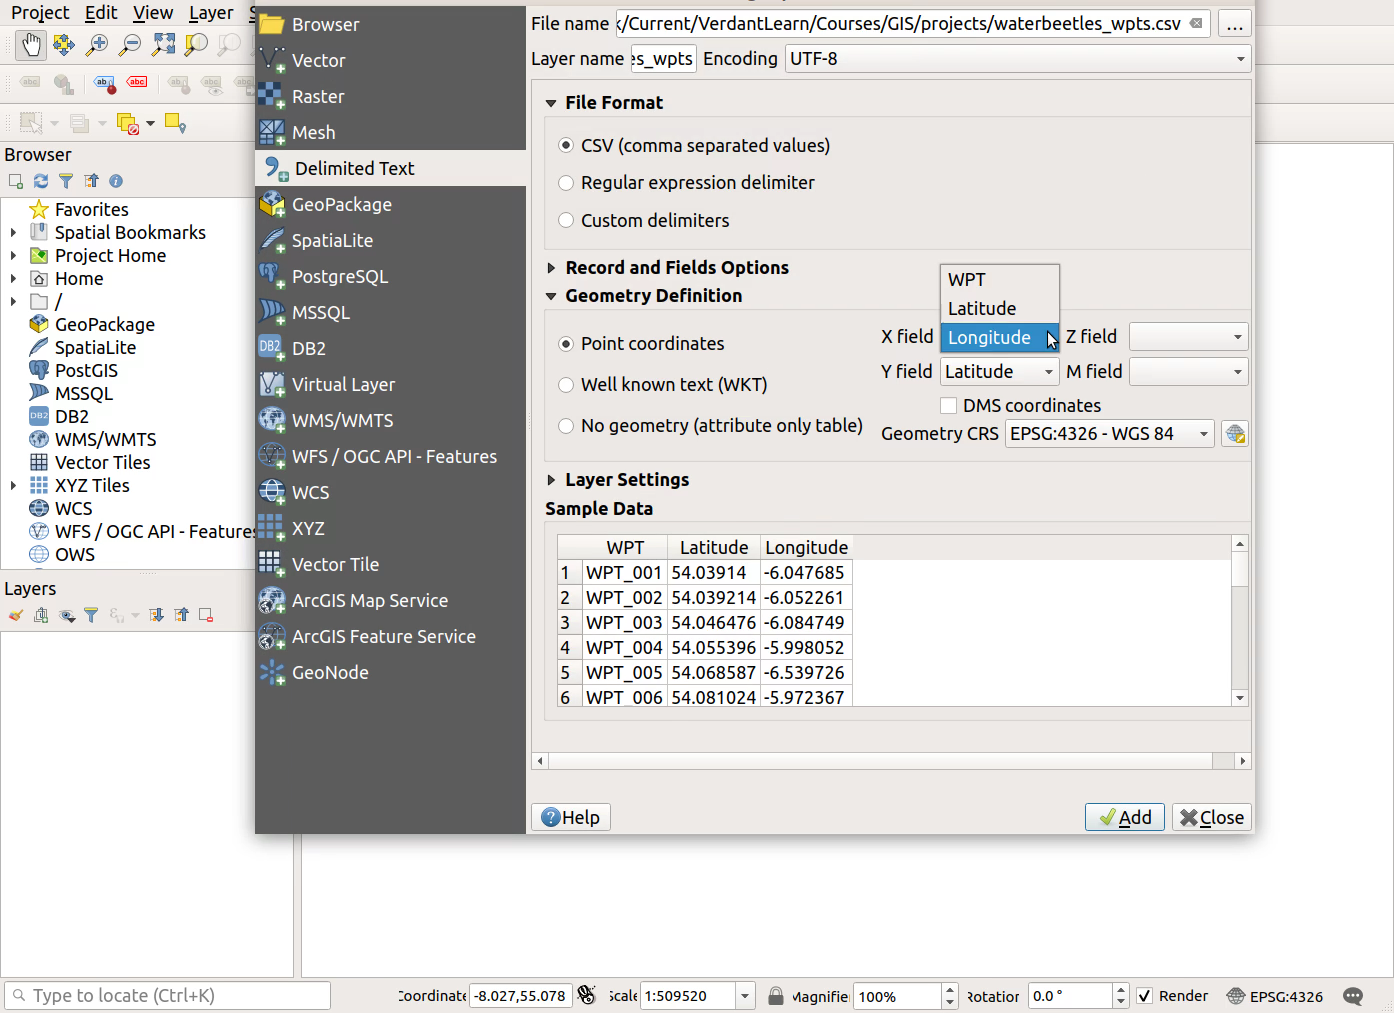
- Ensure
Point coordinatesis selected underGeometry Definition, and specify which columns contain the X and Y coordinates

- Click
AddandClose
Tackling problems
Lean on your learning community if you encounter difficulties - we can help you diagnose what’s wrong and move forward
Next steps
If you’d like to know what else you can do with your point data now they’re in QGIS, look at the Processing points page in Resources