Inspecting data
Let’s take a closer look at your field data or the gibbon datasets ![]() with the help of two very useful QGIS toolbars
with the help of two very useful QGIS toolbars
Map navigation toolbar

- If you have a mouse with a wheel, you can use the wheel to zoom in/out. If not, click on the
Zoom Intooland use it to draw a box (click and drag) on an area of your map that you want to view more closely
- Use the
Pantoolto drag the map around
- Use the
Zoom Outtoolto move ‘further away’ from your data
- A handy shortcut to view the full extent of your datasets is the
Zoom Fulltool
- The
Zoom LastandZoom Nexttoolsare useful to rapidly switch between areas, or go back to a previous view if you moved your view by accident
- We’ll use the other tools on this toolbar later in the course, but you’re welcome to explore them now
Attributes toolbar

- Select the
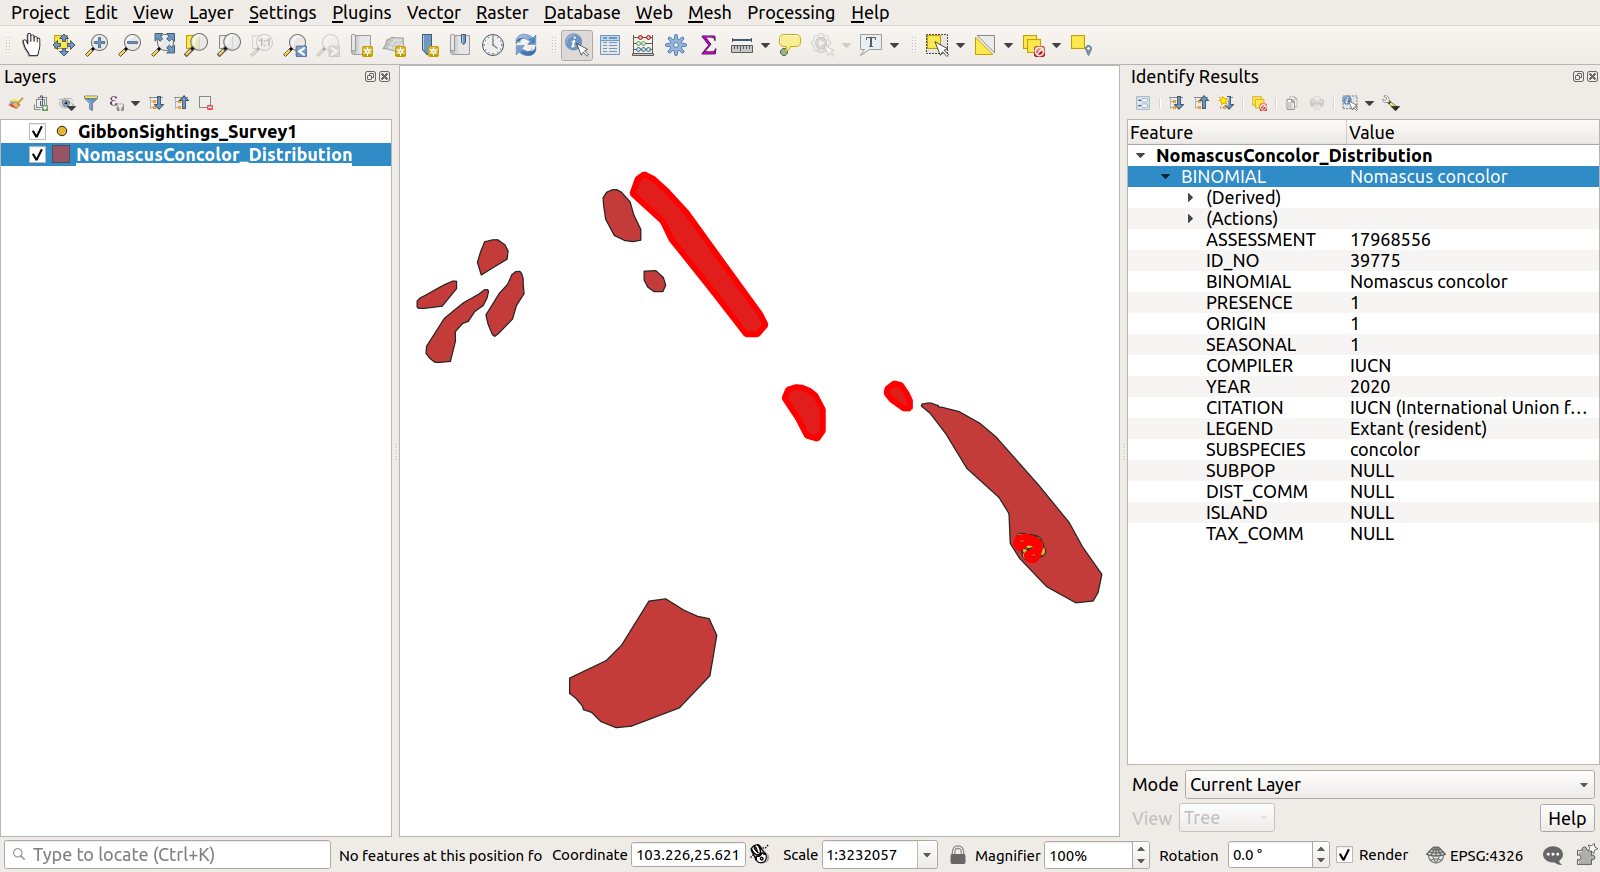
Identify featurestool and click on one of the polygons or points to reveal information about that feature
Warning! This tool only shows information for the layer that is currently highlighted in the Layers panel (top left). So if you’re clicking on points but the Layers panel has NomascusConcolor_Distribution highlighted, nothing will happen! To reveal information from a particular layer, e.g. the gibbon sightings, make sure you’ve first clicked on that layer (GibbonSightings_Survey1) in the Layers panel
- You can close the Identify Results pane by clicking on the top-right [x] button
If you clicked on a polygon to bring up the Identify Results pane, your project will look like this:

Previous submodule:
Gibbon case study
Next submodule:
Layers panel