Specify a dataset’s CRS in QGIS
To understand better how QGIS deals with data collected using a different SRS, let’s add another new file to our QGIS project
The team leader of the gibbon surveys, Phuong, has received new data from her colleague Binh from a second gibbon survey in the westernmost edge of the nature reserve. Binh has provided data as a .csv. Let’s look at the raw data before we add it to our GIS project
- Download GibbonSightings_Survey2.csv
- Open up GibbonSightings_Survey2.csv in Excel or your text editor
- Examine the columns and identify those which contain the location information. Compare them to the coordinate columns in Threats_Evidence.csv
- Do you think the sighting locations are in Latitude-Longitude, or a different SRS?
You’re right!
Answer
Binh’s observations were collected in a different SRS, known as NSIDC EASE-Grid Global, EPSG code 3410
Now we know a little more about the dataset, we can add it to our project. The process is similar to adding Threats_Evidence.csv, but this time we need to tell QGIS which map projection the dataset uses
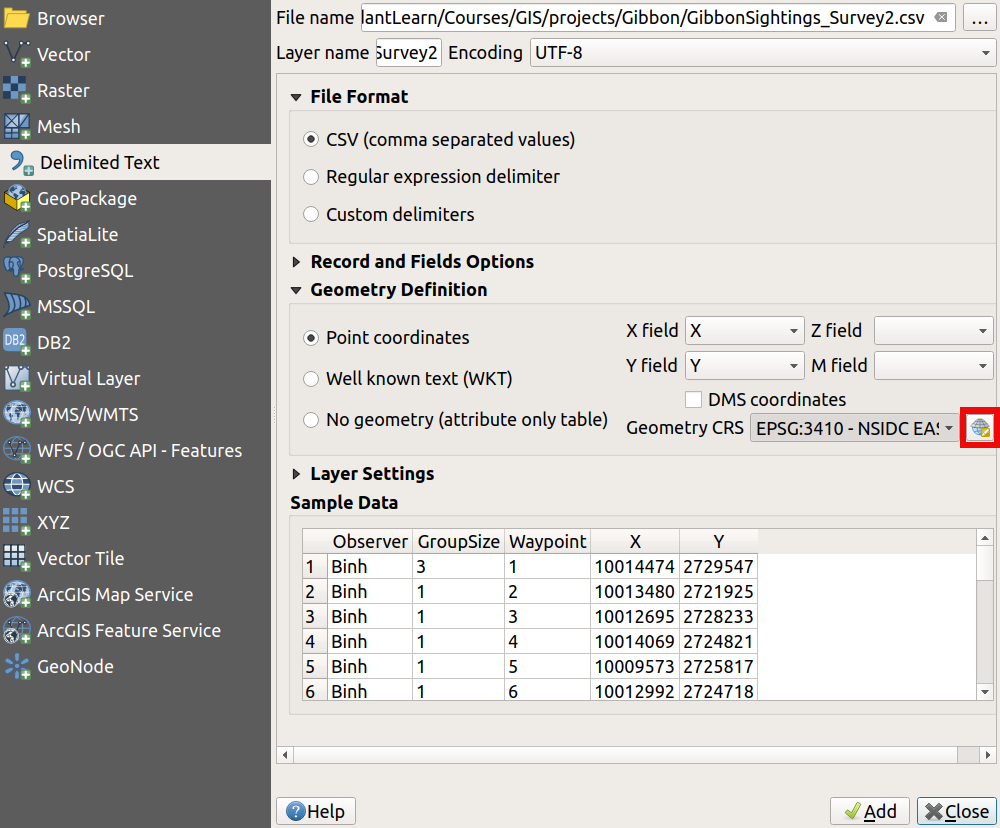
Layer > Add Layer > Add Delimited Text Layer...- Choose source file - click the
...button and find GibbonSightings_Survey2.csv- Ensure
Point coordinatesis selected underGeometry Definition- QGIS will automatically recognise which columns contain the X and Y coordinates from the column names, but we need to specify the CRS. Under
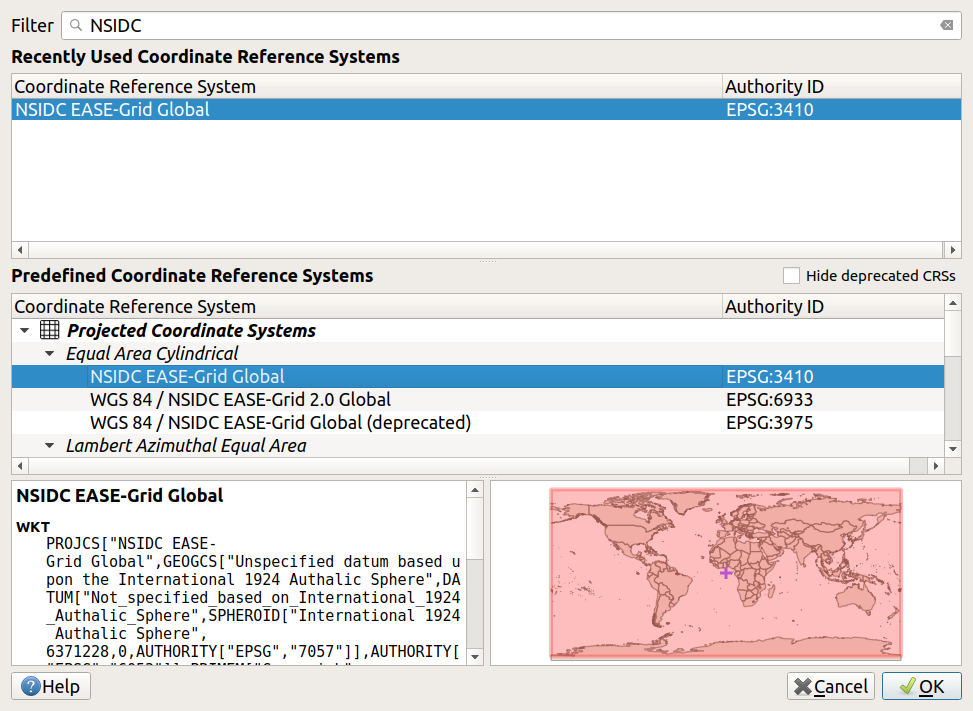
Geometry Definition, click on the tinySelect CRSbutton on the right-hand edge of the window- Search for NSIDC in the
Coordinate Reference System Selectorwindow - select it and clickOK- Click
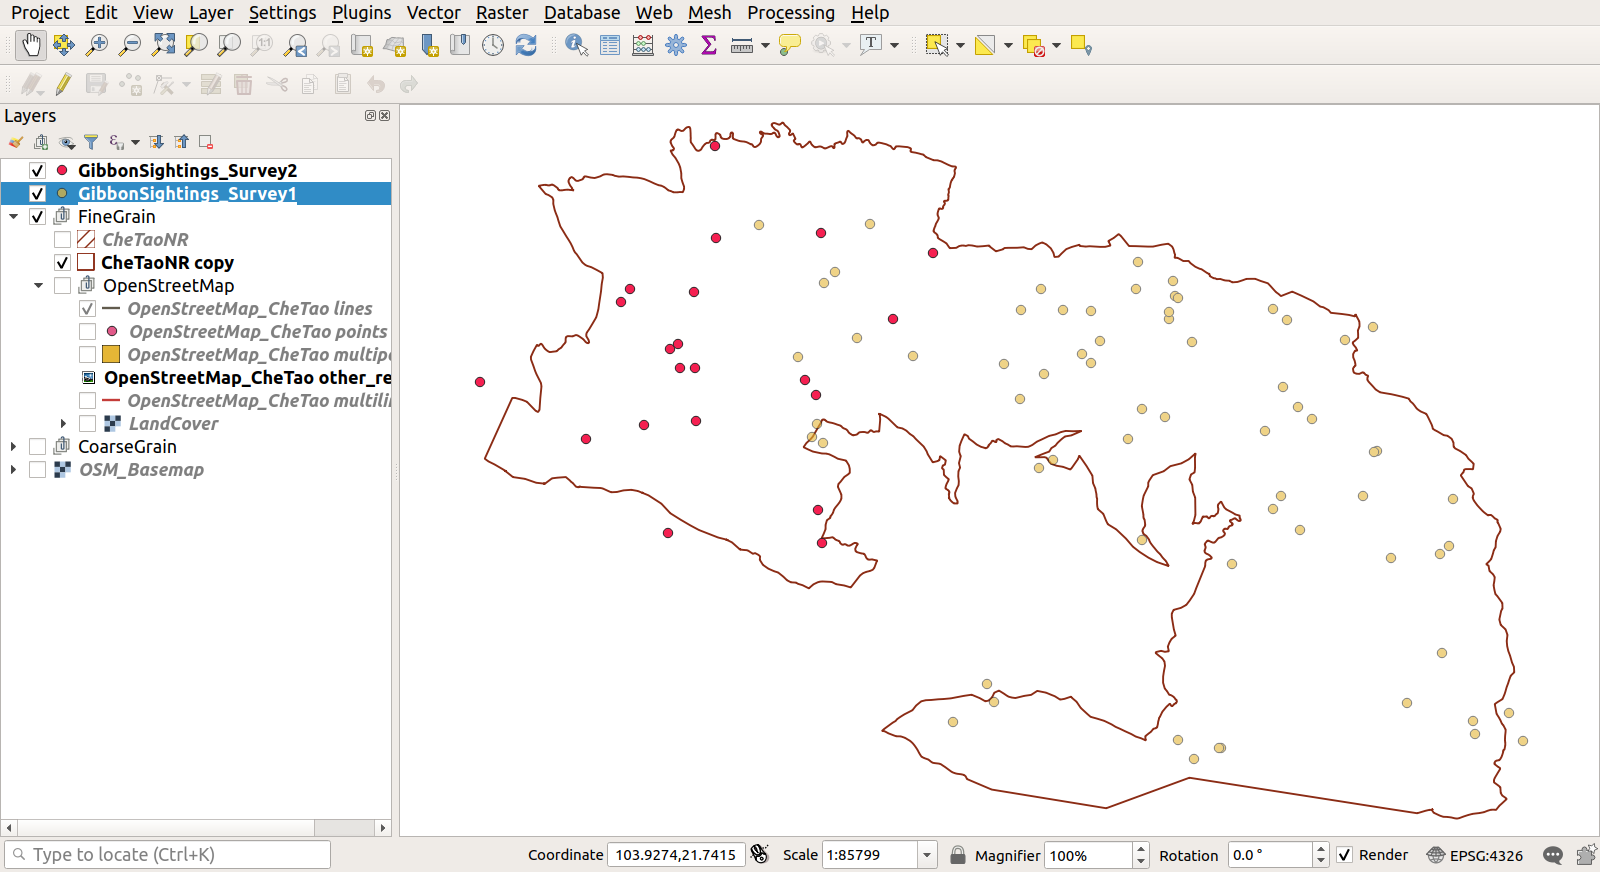
AddandClose- Check that the new sightings have appeared in the correct place on your map
Previous submodule:
Geodetic datums
Next submodule:
Choosing an SRS


