Import Latitude-Longitude
You may already be familiar with Latitude-Longitude coordinates from your own field data. If not, you can try inspecting and importing this dataset from the gibbon case study
The Che Tao NR staff have provided us with new data from their most recent patrol, looking for evidence of threats to wildlife
.csv file format
Threats_Evidence.csv is in .csv format, or comma-delimited, with columns separated by a comma. .csv is a non-spatial file format, although as you’ll see, it does contain spatial information
Remember that QGIS won’t automatically know where to draw data in .csv format, so we have to tell it where the location coordinates are stored. Before we do that, let’s take a look at the raw data
- Download Threats_Evidence.csv
- Open up the .csv file in Excel (or a text editor if you prefer)
- Examine the columns:
- Does the information you’ve been given make sense?
- What type of vector data do we have - points, lines or polygons?
- Do you understand what the numbers in the coordinate columns mean?
Add .csv data to QGIS
Here’s a reminder of how to add .csv files:
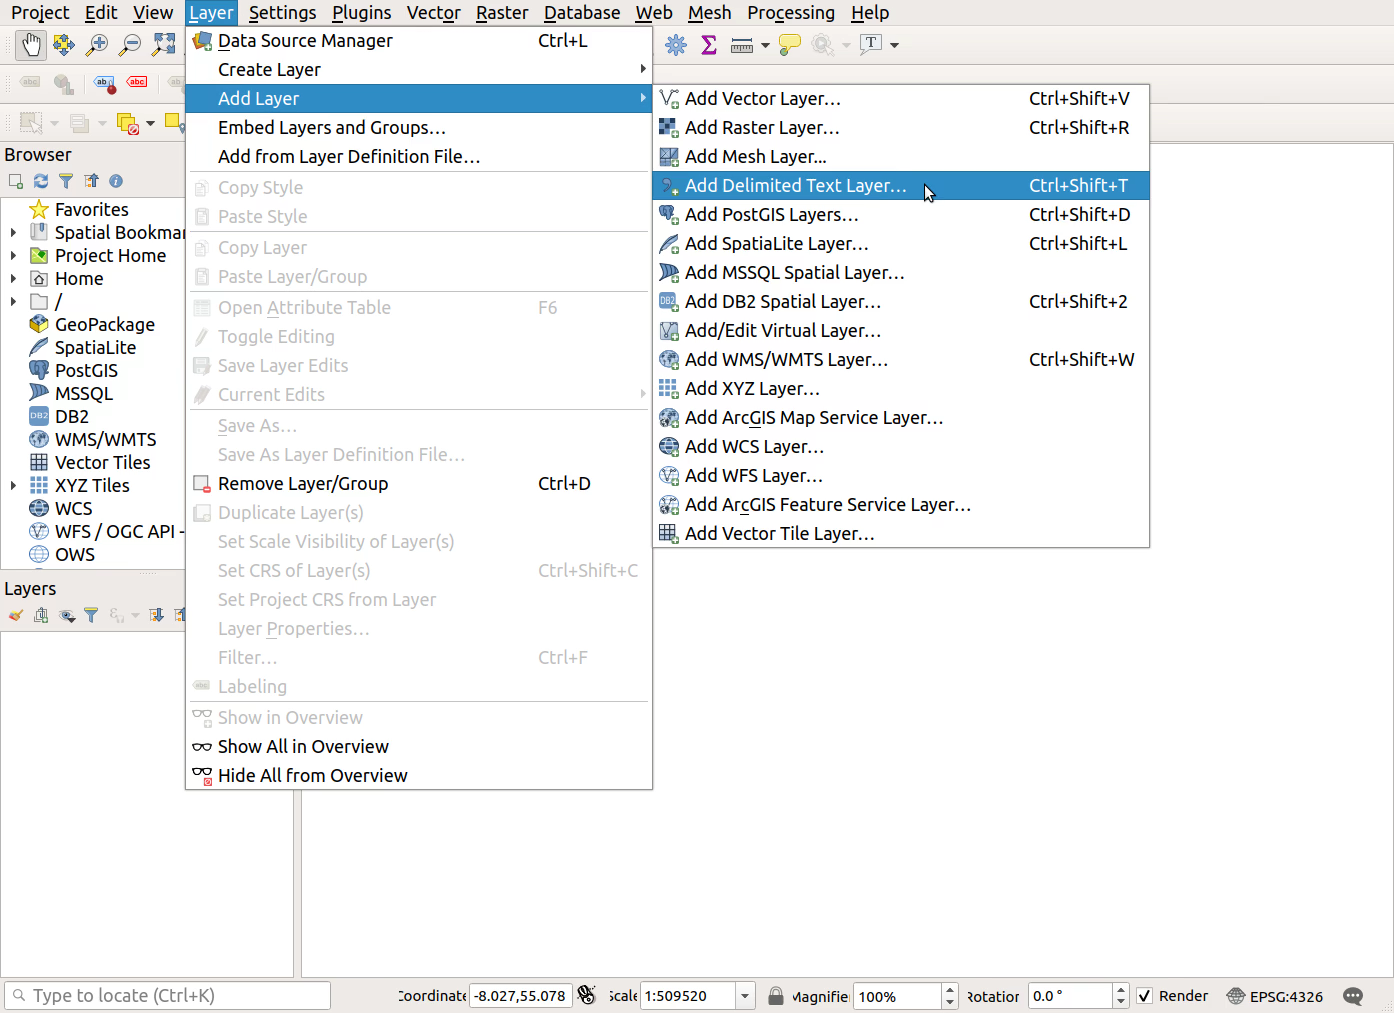
Layer > Add Layer > Add Delimited Text Layer...
Screenshot
Be aware that the csv file in these screenshots is different from yours!

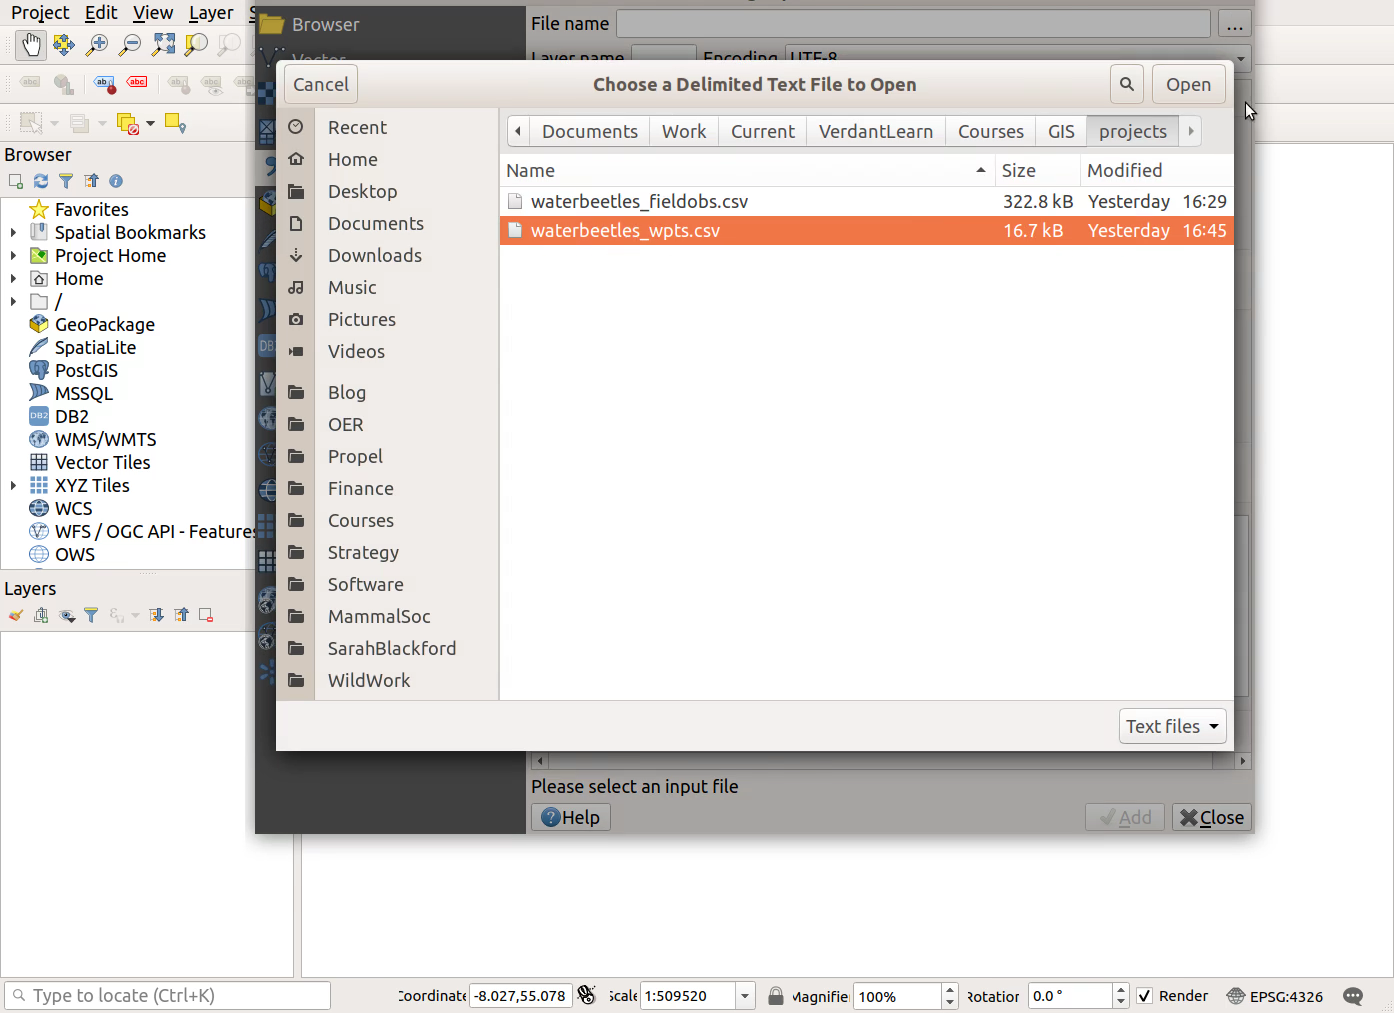
- Choose source file - click the
...button and find Threats_Evidence.csv
Screenshot

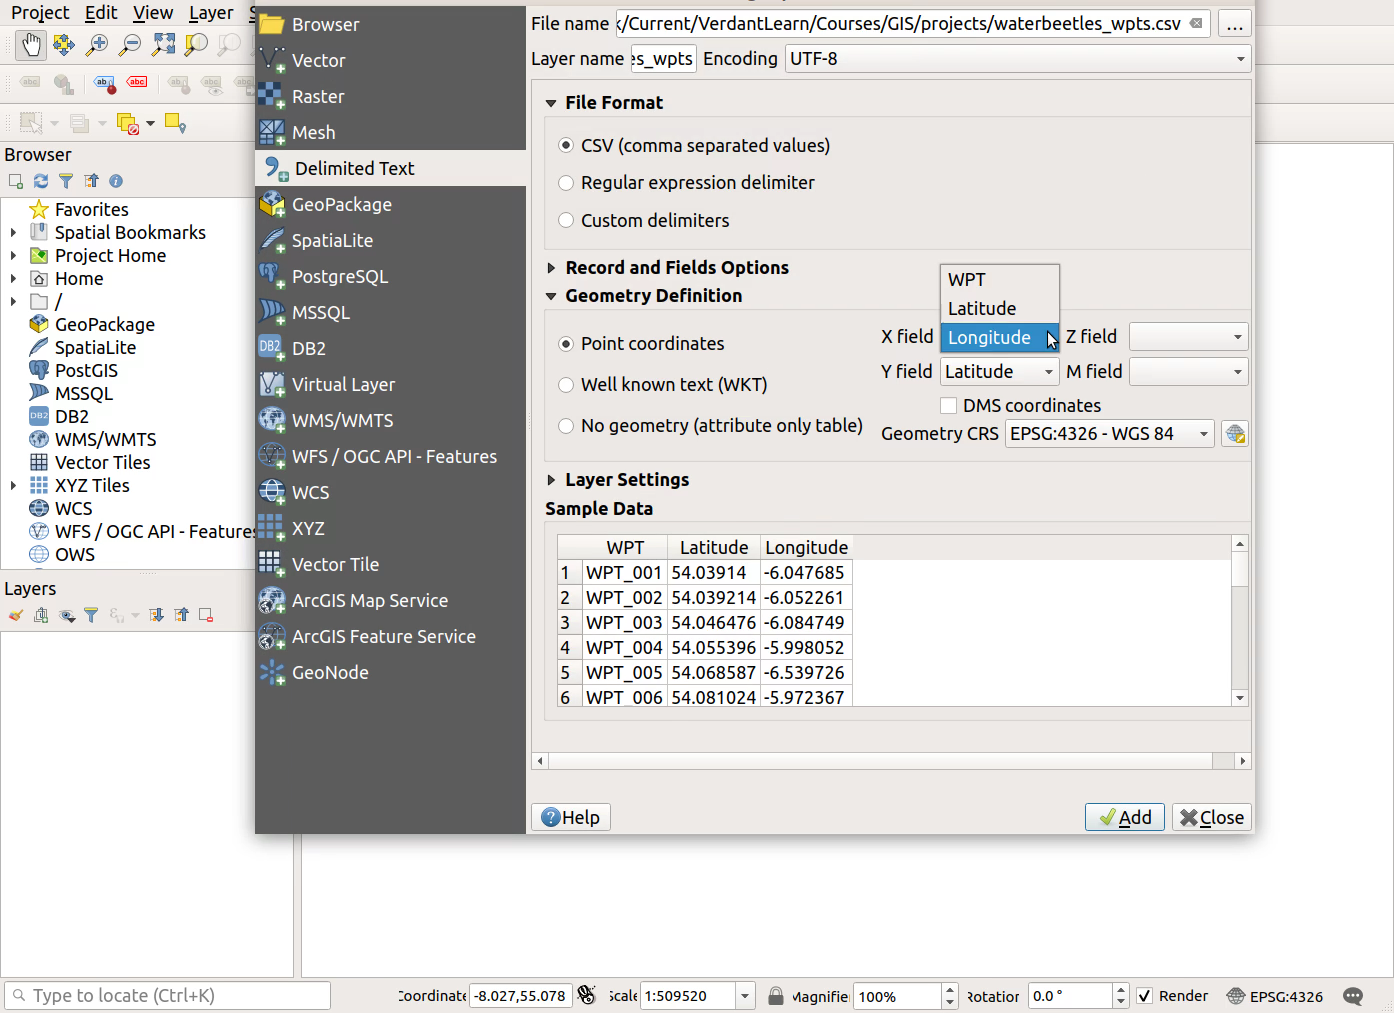
- Ensure
Point coordinatesis selected underGeometry Definition
Screenshot

- QGIS should automatically recognise which columns contain the X (Longitude) and Y (Latitude) coordinates
- Click
AddandClose
Previous submodule:
Latitude-Longitude
Next submodule:
Map projections