Visualise categorical field data
15 minutes
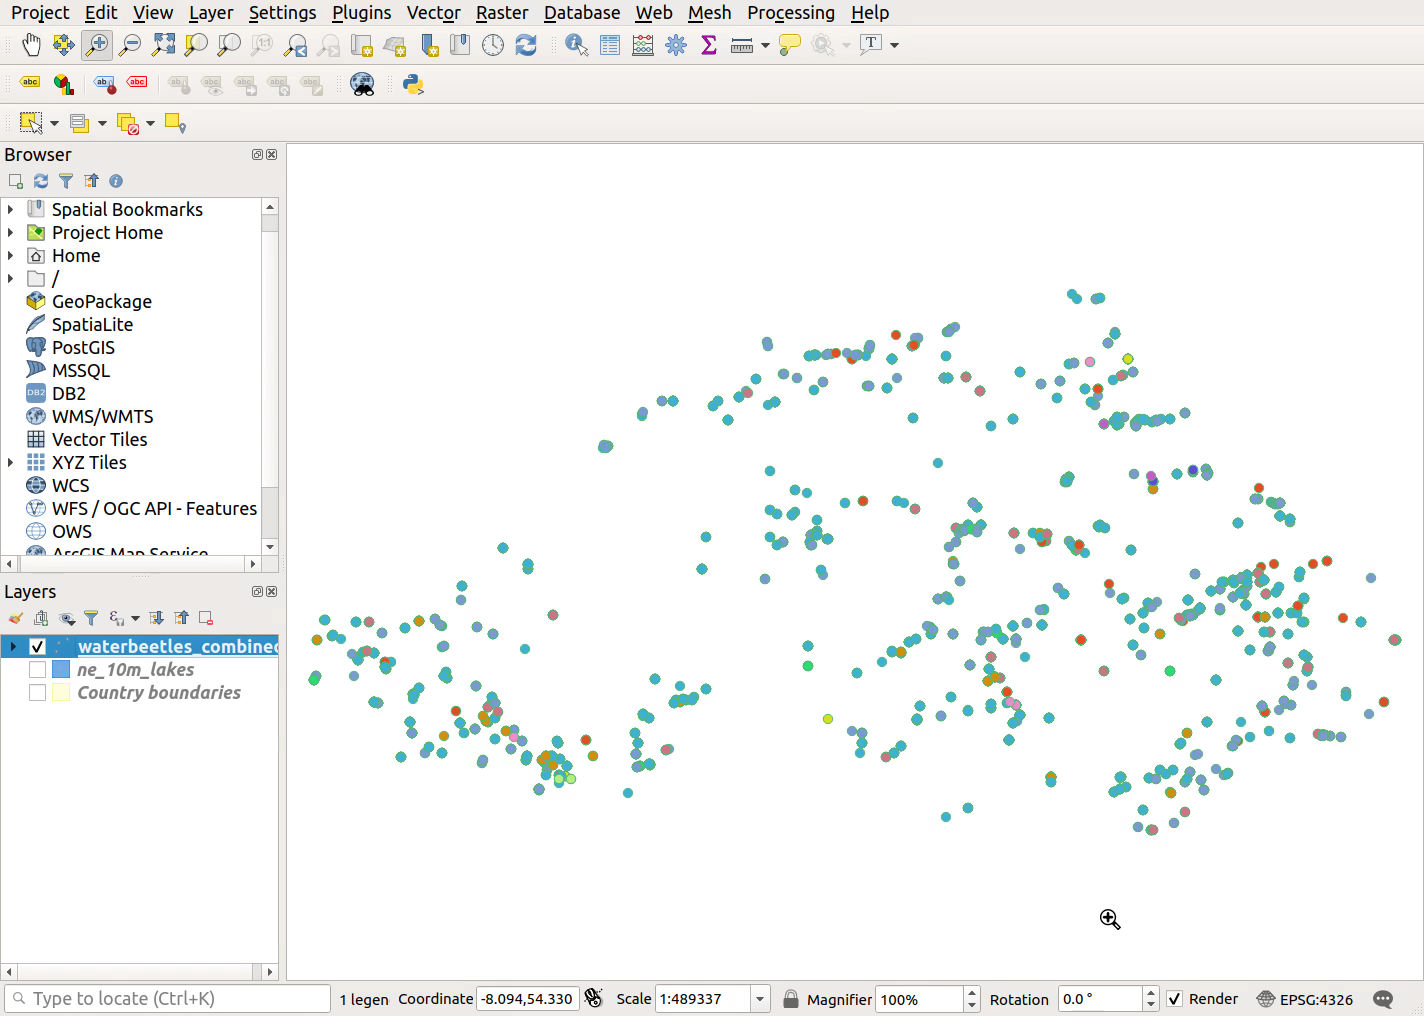
Today’s exercises are designed to refresh your memory of how to adjust the symbology of vector data in QGIS. In other words, you’ll practice displaying your field data in different ways
We’ll start with visualising categorical data, also known as qualitative, thematic or nominal data
If you’re working with you own field data, select a column that contains categories, either as text (site names, species, named vegetation types) or numbers (e.g. numerical code for vegetation type or observer)
If you’re working with the water beetle example data, the categorical variables are the taxonomic information: Scientific name, Common name and Family
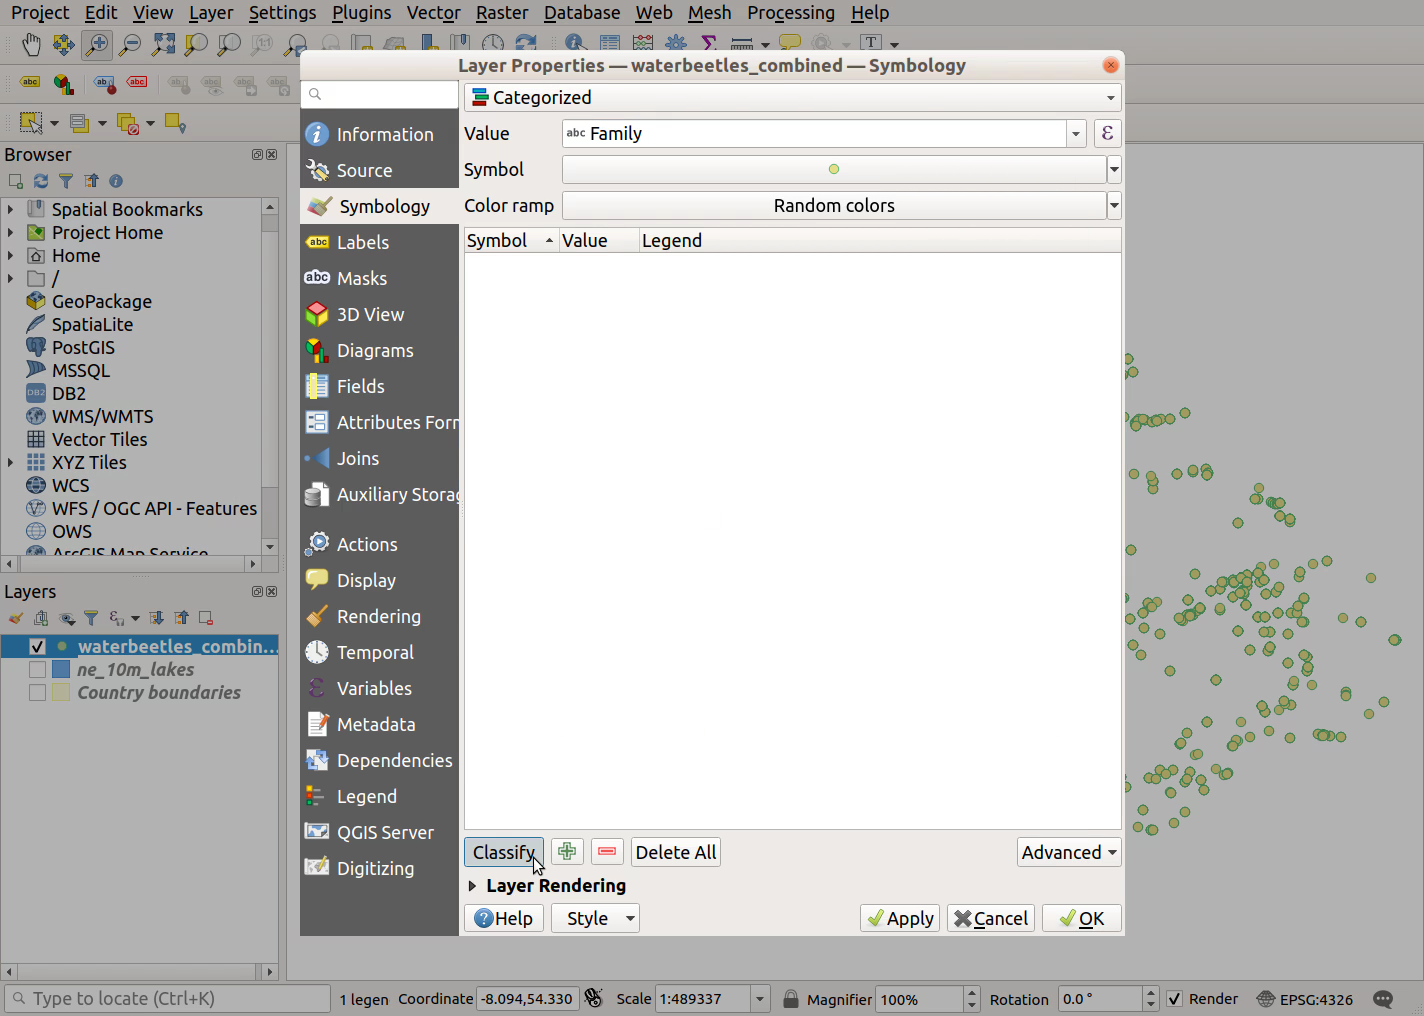
- Open the layer properties - double-click or right-click >
Properties)- Select the
Symbologytab from the left-hand menu- Select
Categorizedfrom the dropdown menu at the top- Choose the column you want to symbolise from the
Valuedropdown menu; for the water beetle dataset, we’ll choose Family- Click on the
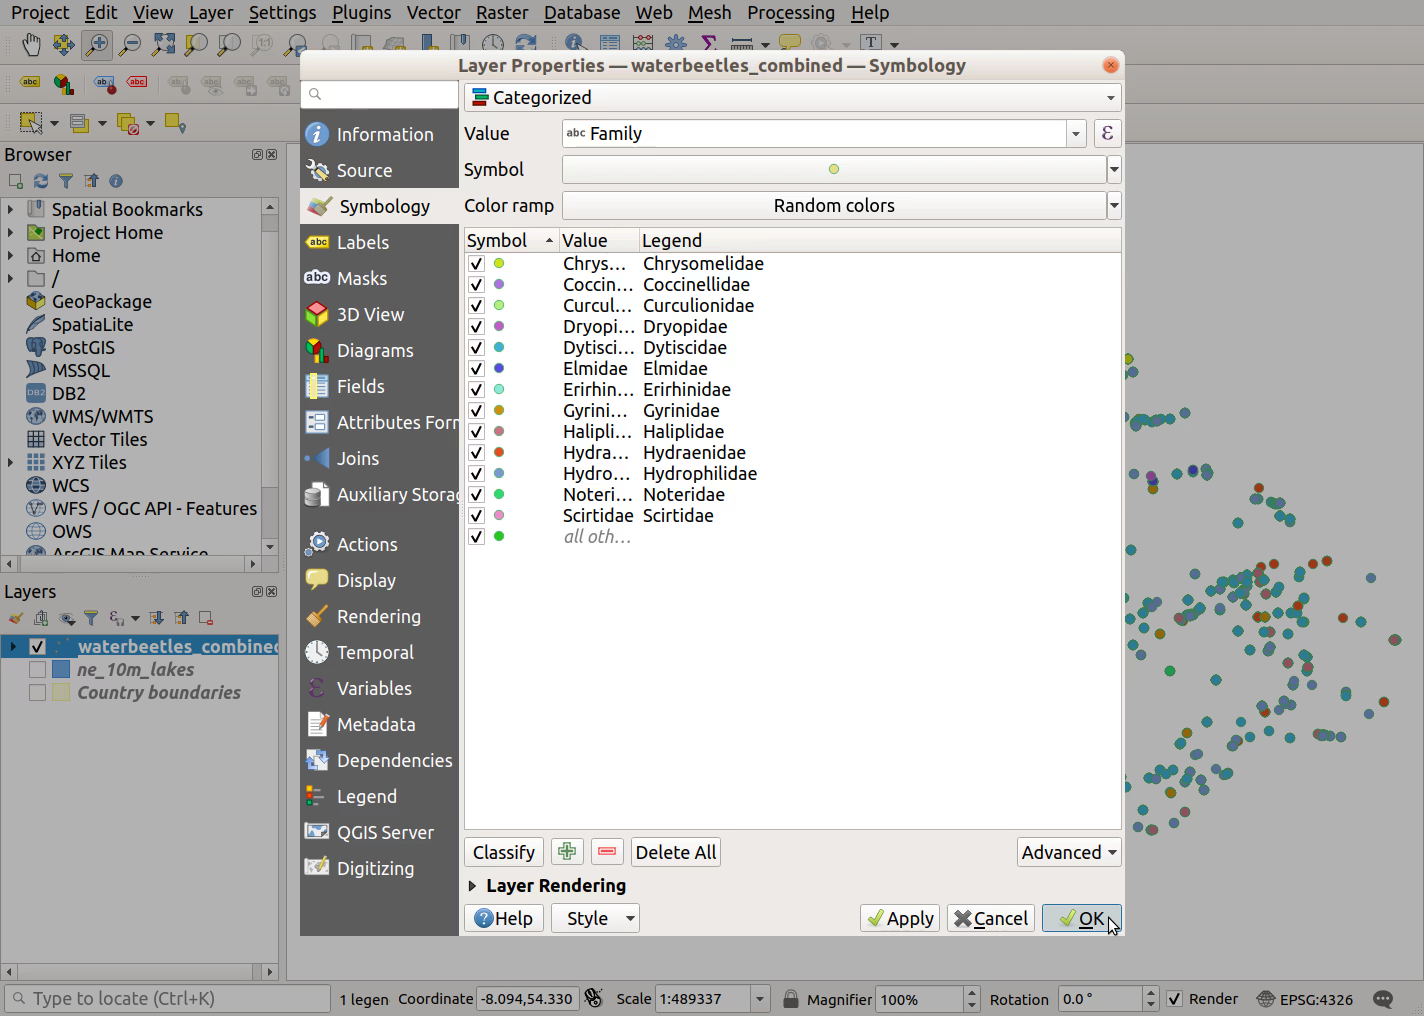
Classifybutton in the bottom left- Click
ApplyandOKto finish
- Open the layer properties - double-click or right-click >
Properties)
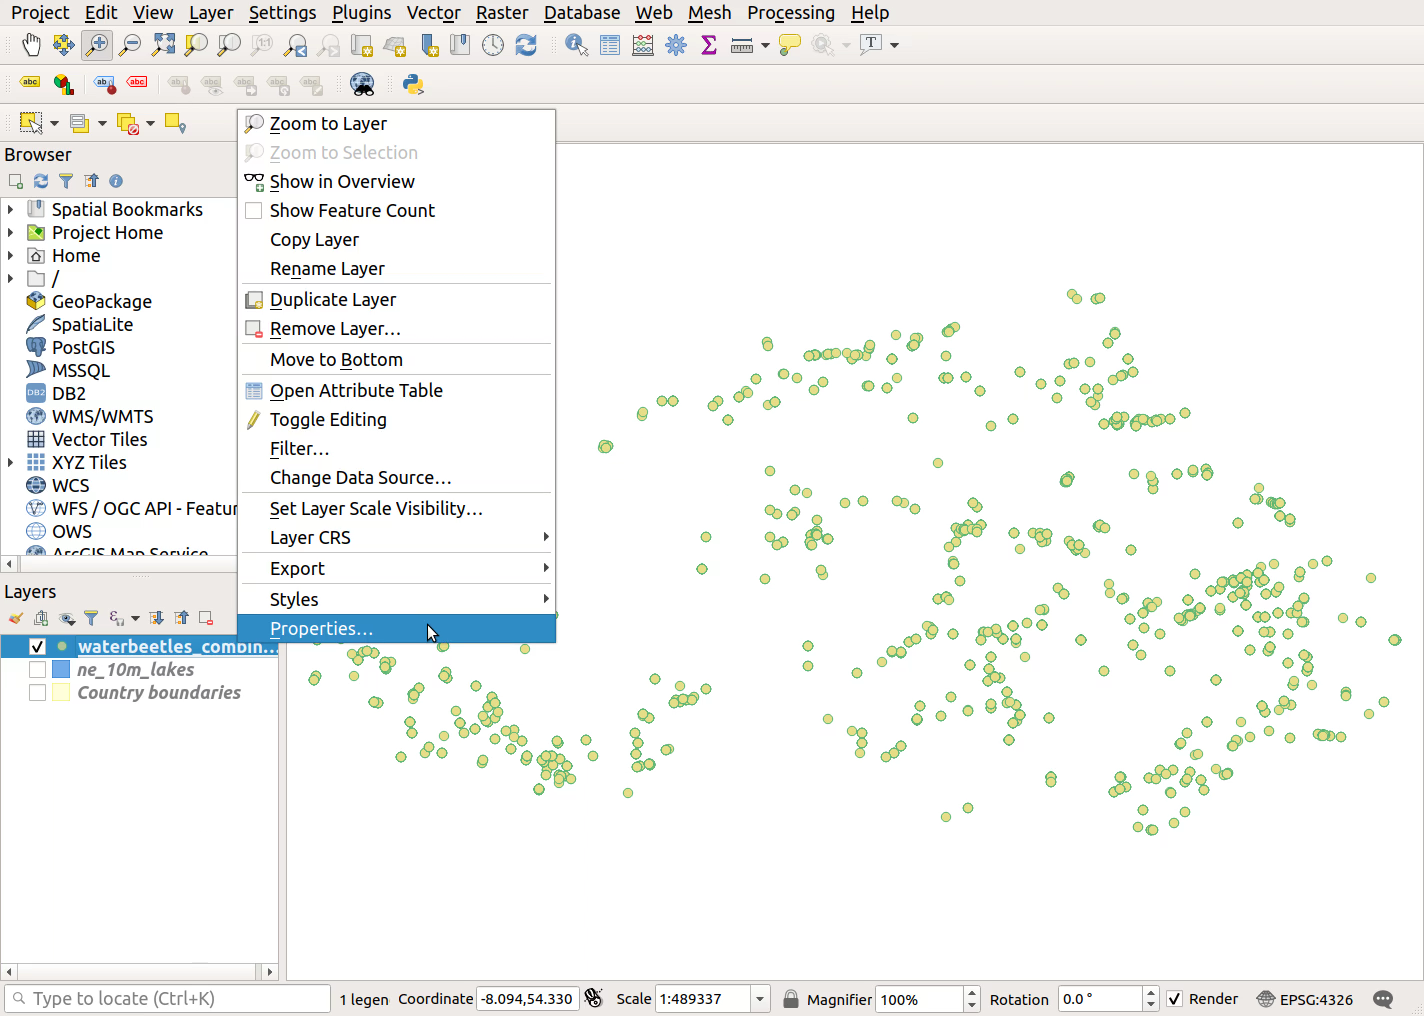
- Select the
Symbologytab from the left-hand menu
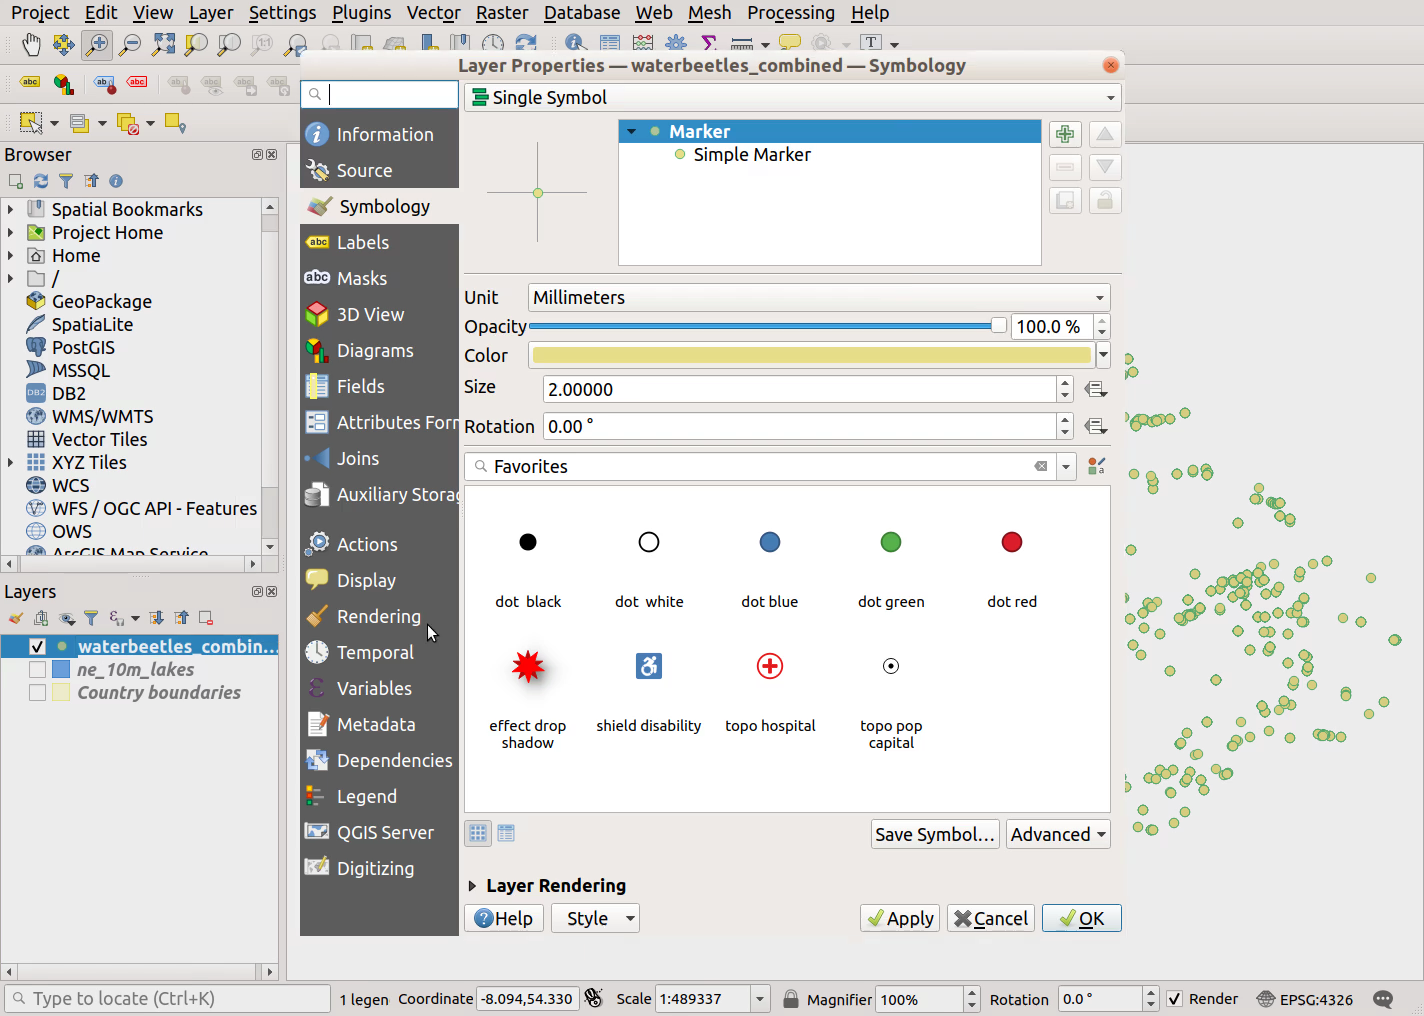
- Select
Categorizedfrom the dropdown menu at the top
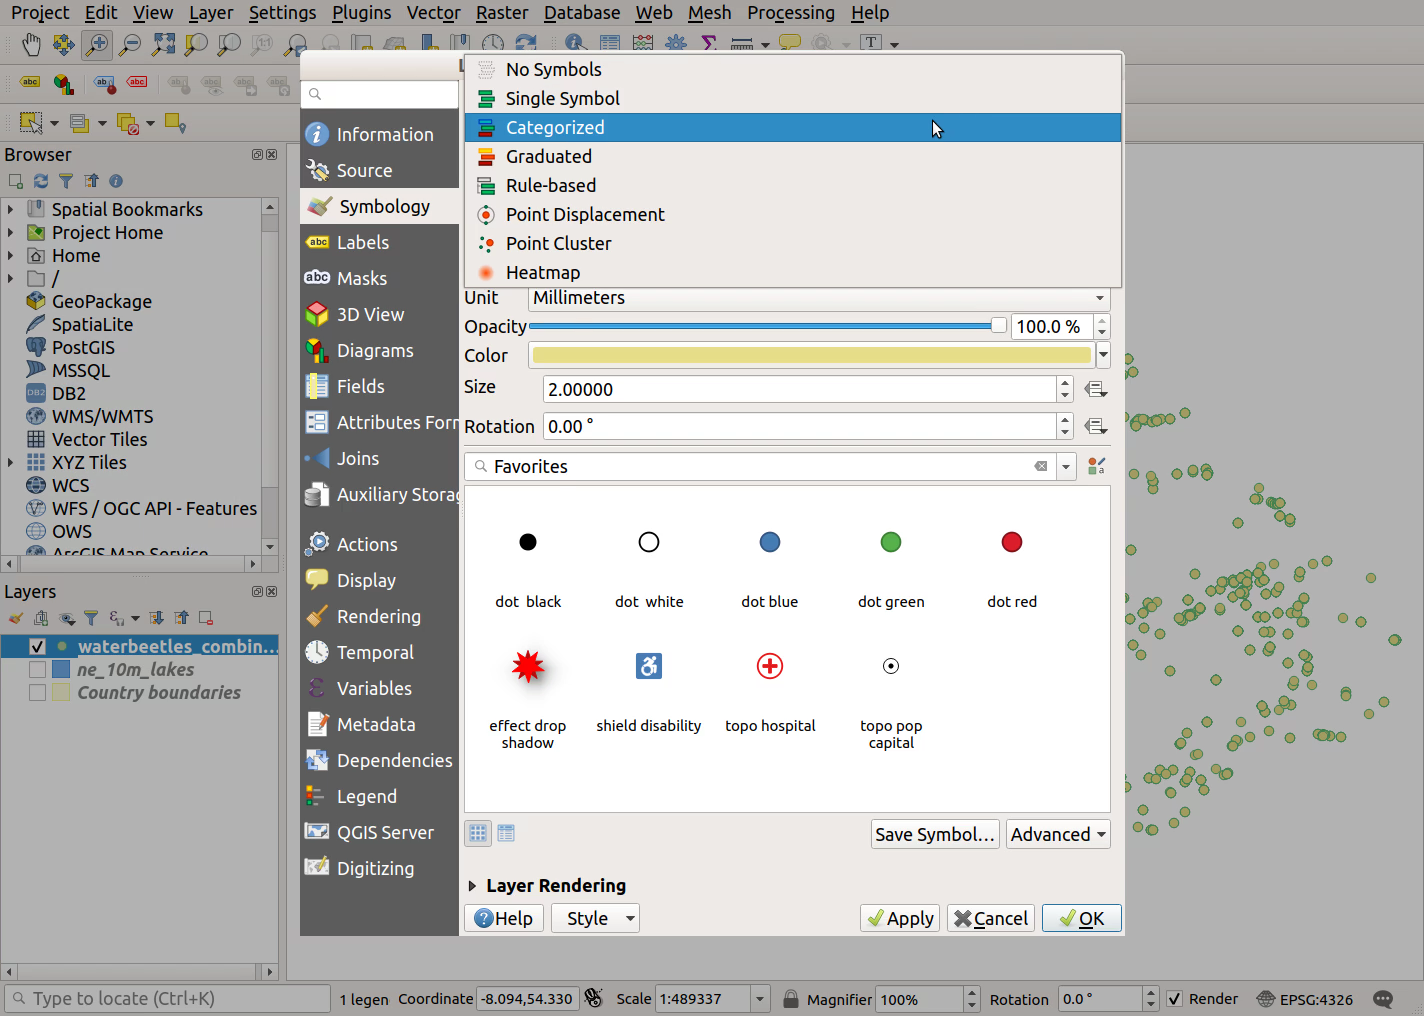
- Choose the column you want to symbolise from the
Valuedropdown menu; for the water beetle dataset, we’ll choose Family
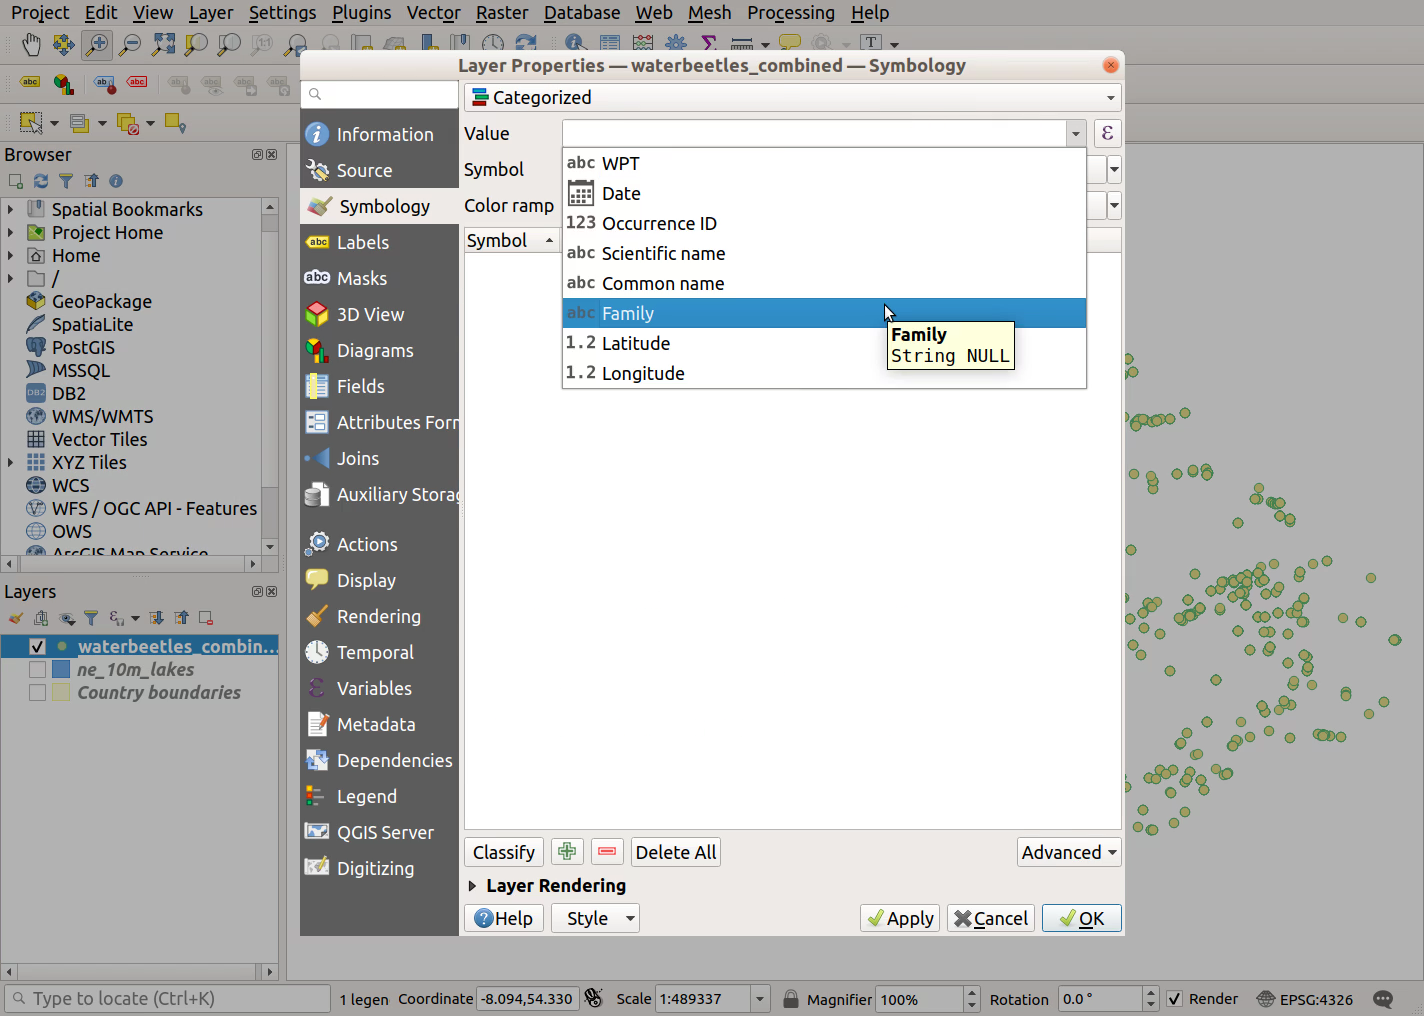
- Click on the
Classifybutton in the bottom left
- Click
ApplyandOKto finish
Previous submodule:
Thursday intro
Next submodule:
Calculate a new field