Visualise numerical field data
15 minutes
Now we are ready to complete the final exercise for today - it’s time to visualise numerical data!
- If you’re working with your own field data, choose a field that contains numerical data such as plant density or number of hunting snares
- For the water beetles example, we’ll use the Year column we created in the previous exercise
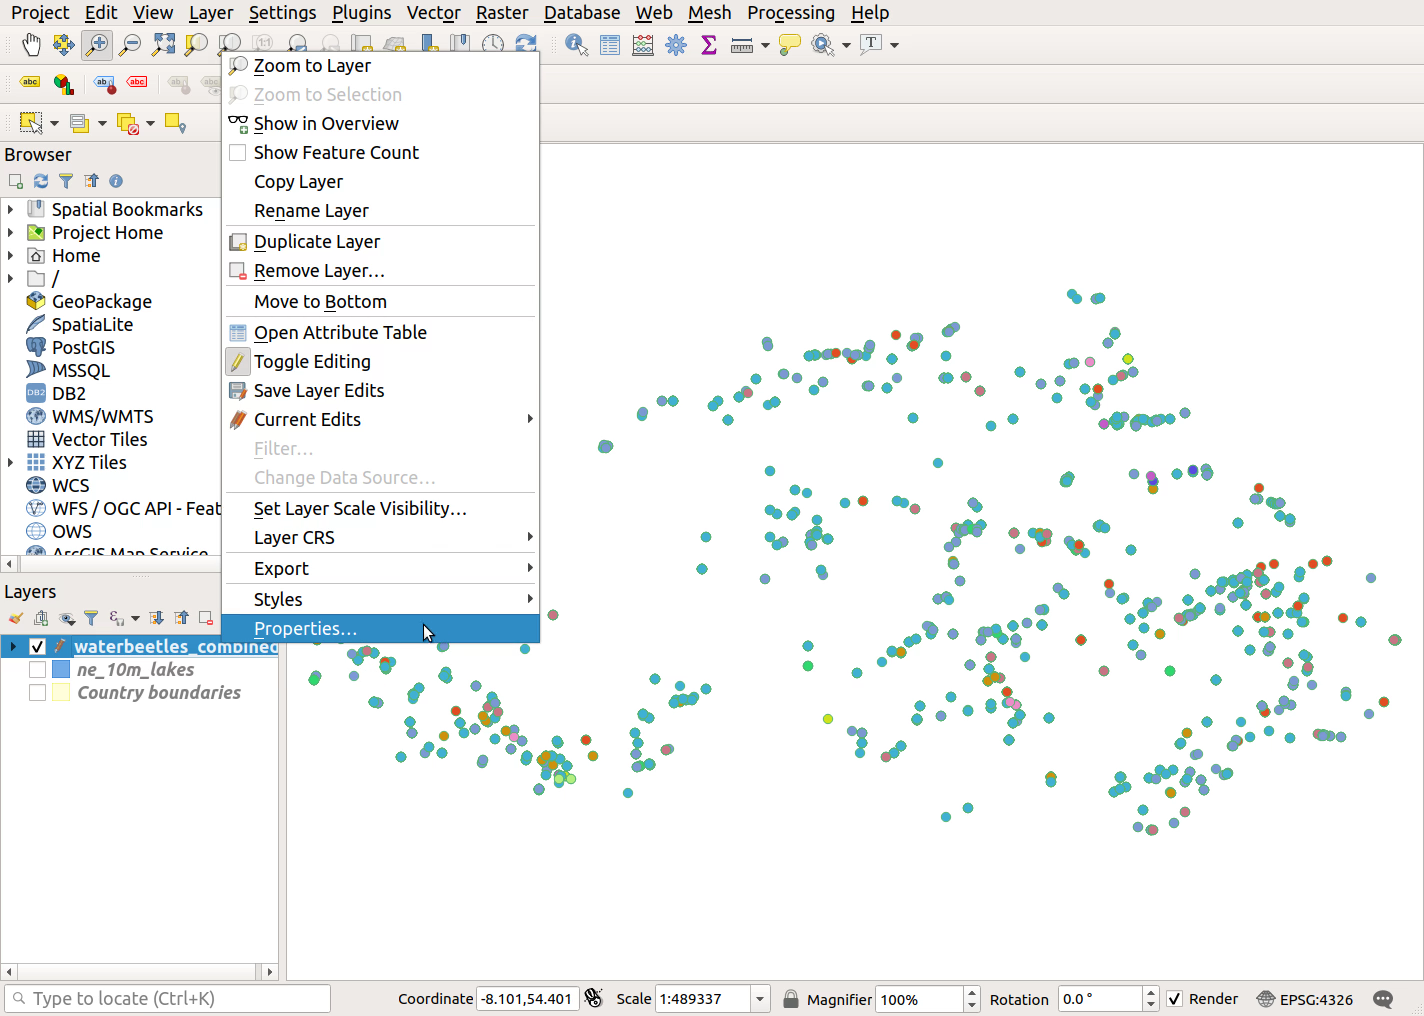
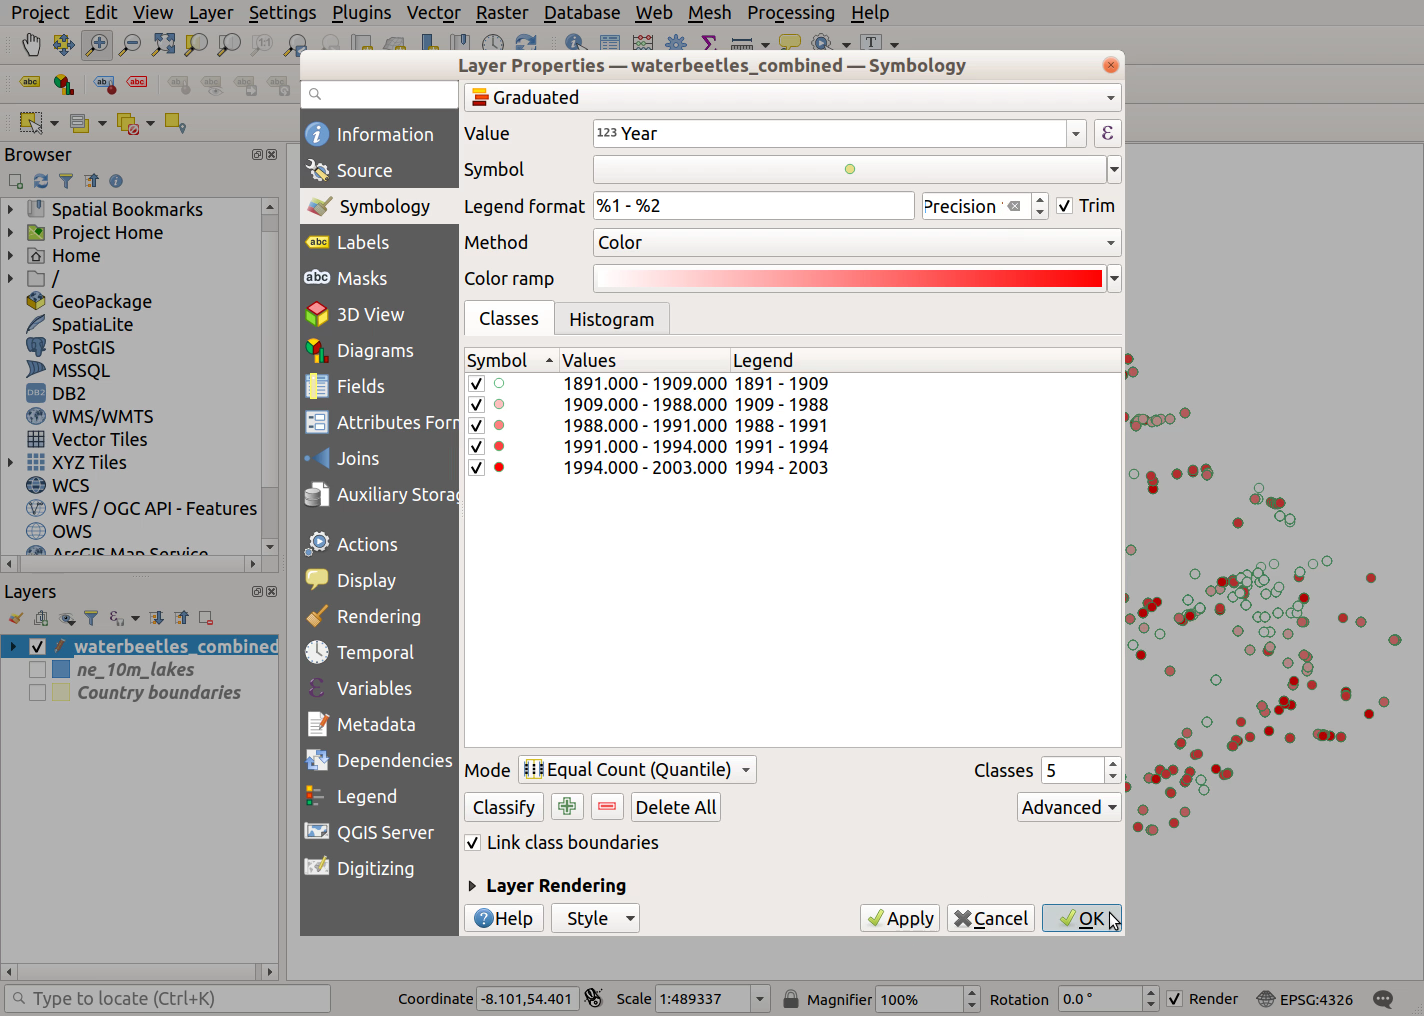
- Open the layer properties - double-click or right-click >
Properties)- In the
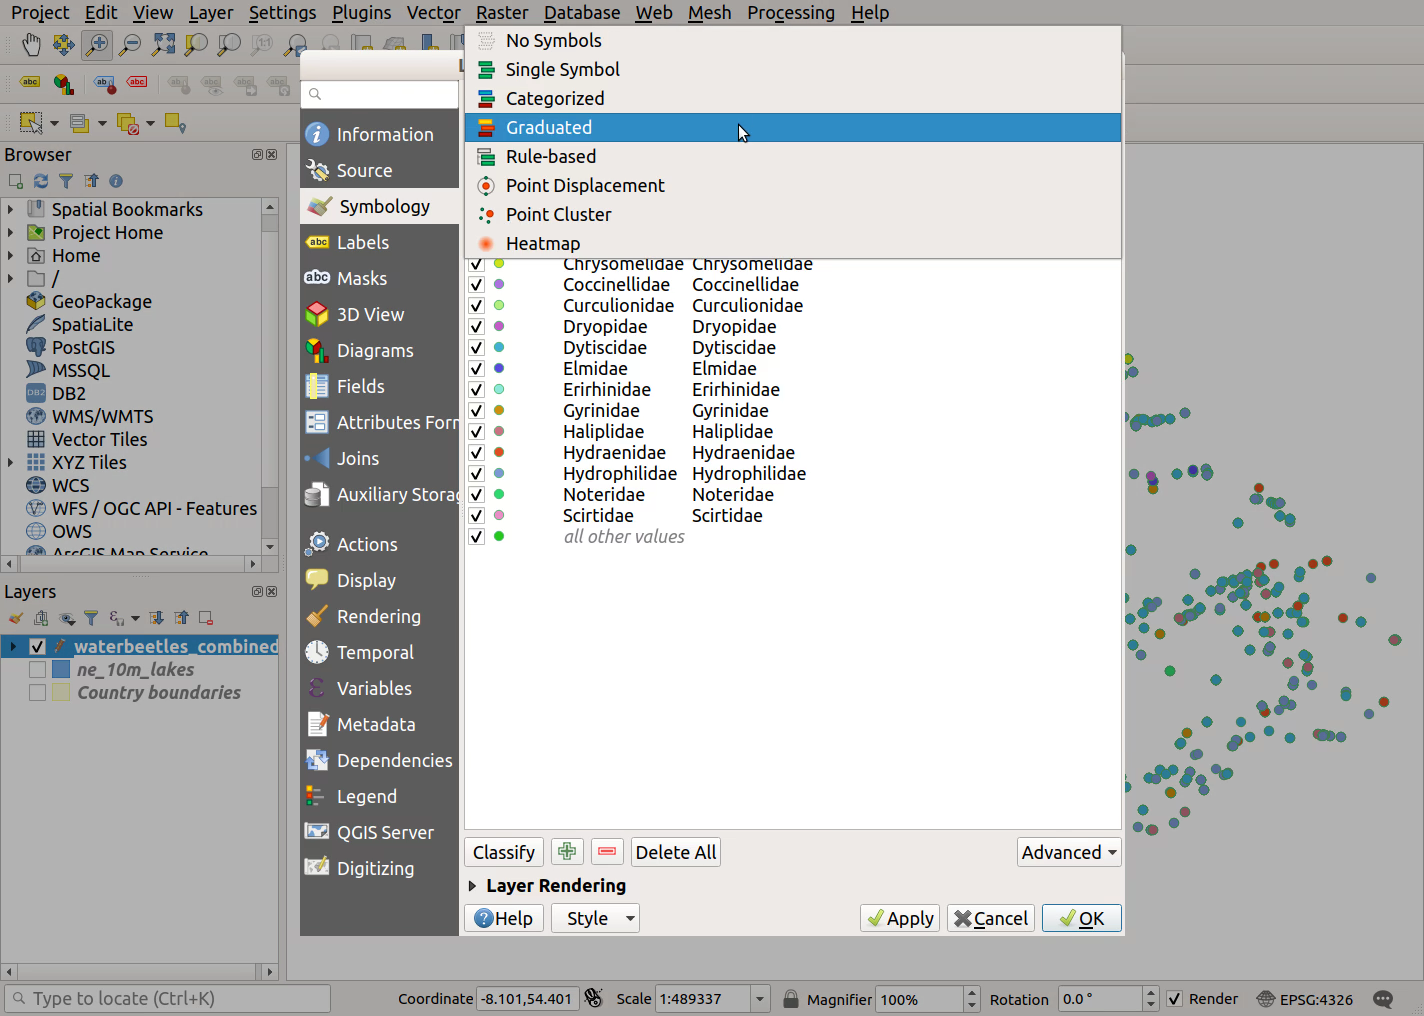
Symbologytab, selectGraduatedfrom the dropdown menu at the top- Choose the column you want to symbolise from the
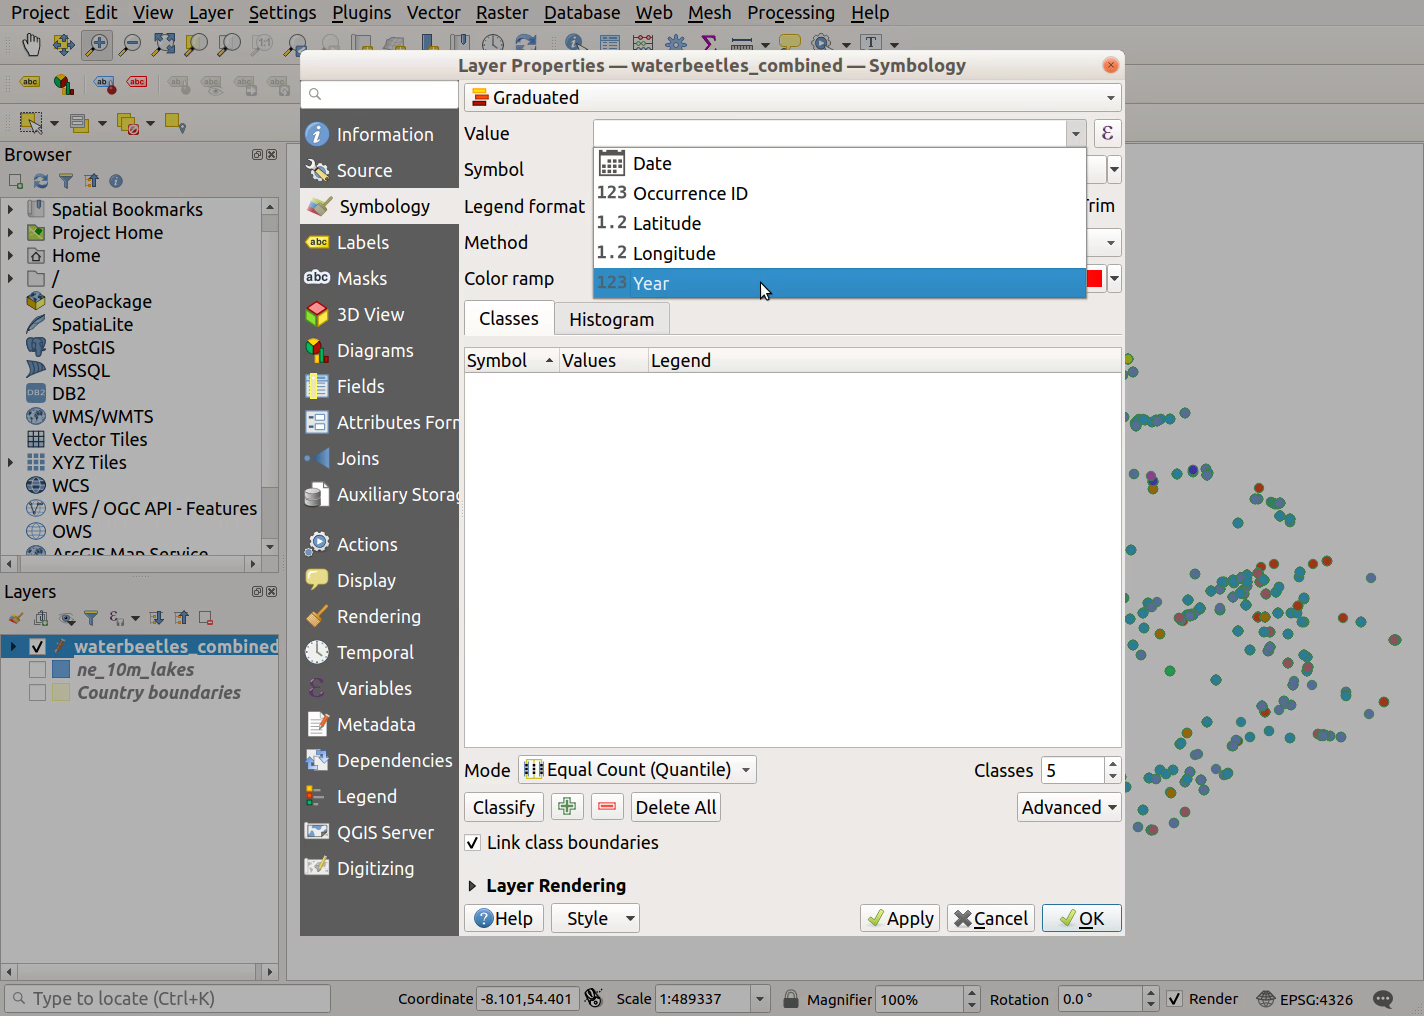
Valuedropdown menu; for the water beetle dataset, we’ll choose our newly calculated field Year- Click on the
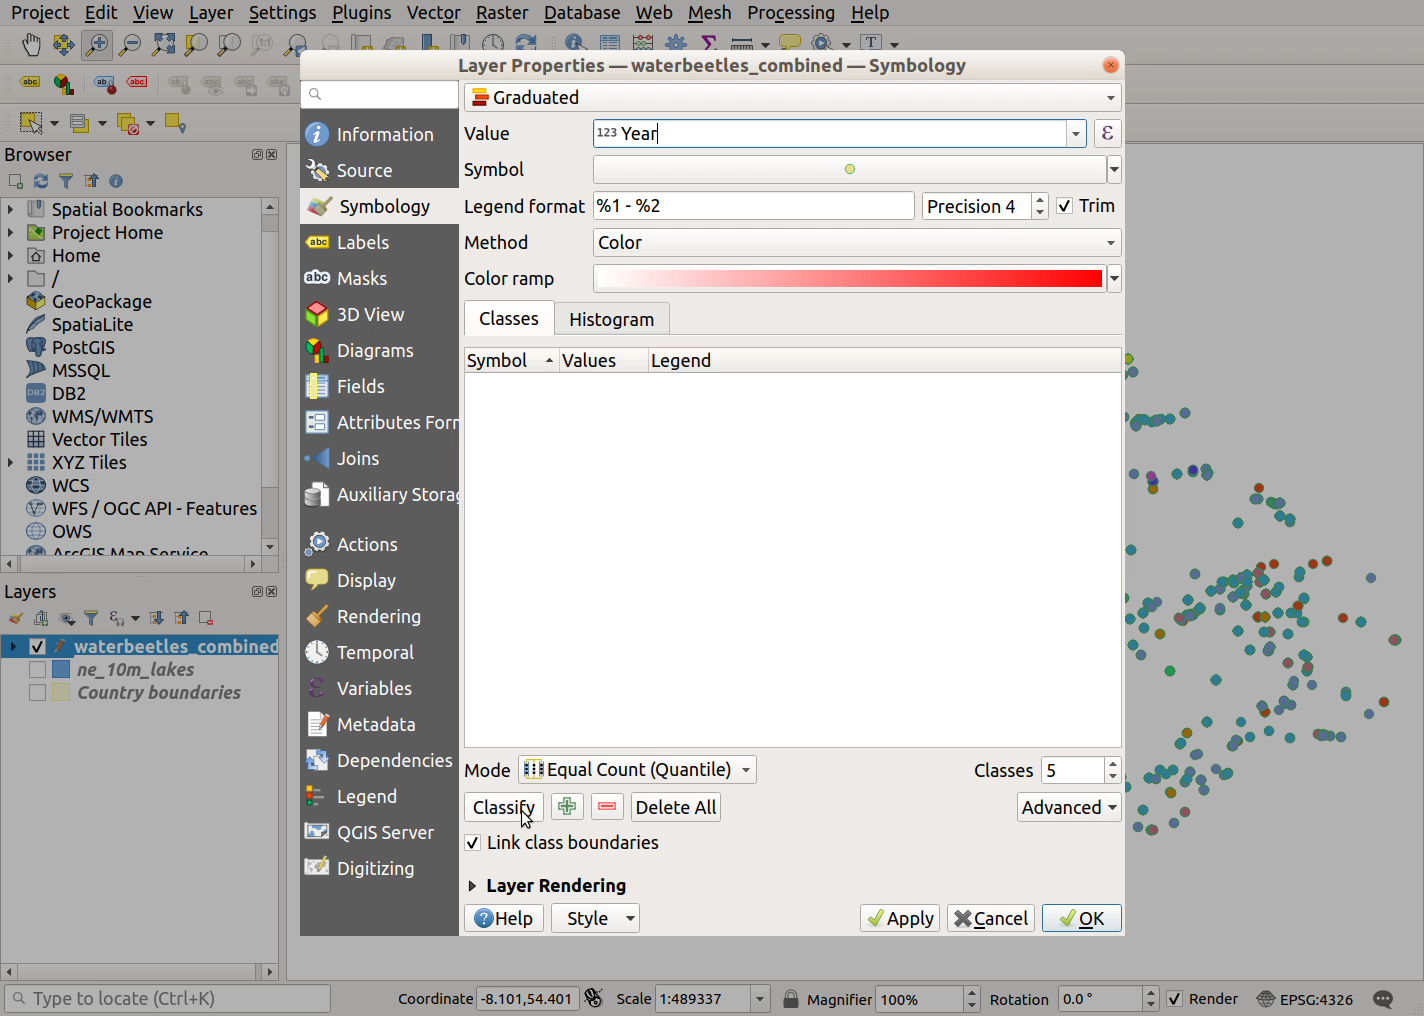
Classifybutton in the bottom left- Click
ApplyandOKto finish
- Open the layer properties - double-click or right-click >
Properties)
- In the
Symbologytab, selectGraduatedfrom the dropdown menu at the top
- Choose the column you want to symbolise from the
Valuedropdown menu; for the water beetle dataset, we’ll choose our newly calculated field Year
- Click on the
Classifybutton in the bottom left
- Click
ApplyandOKto finish
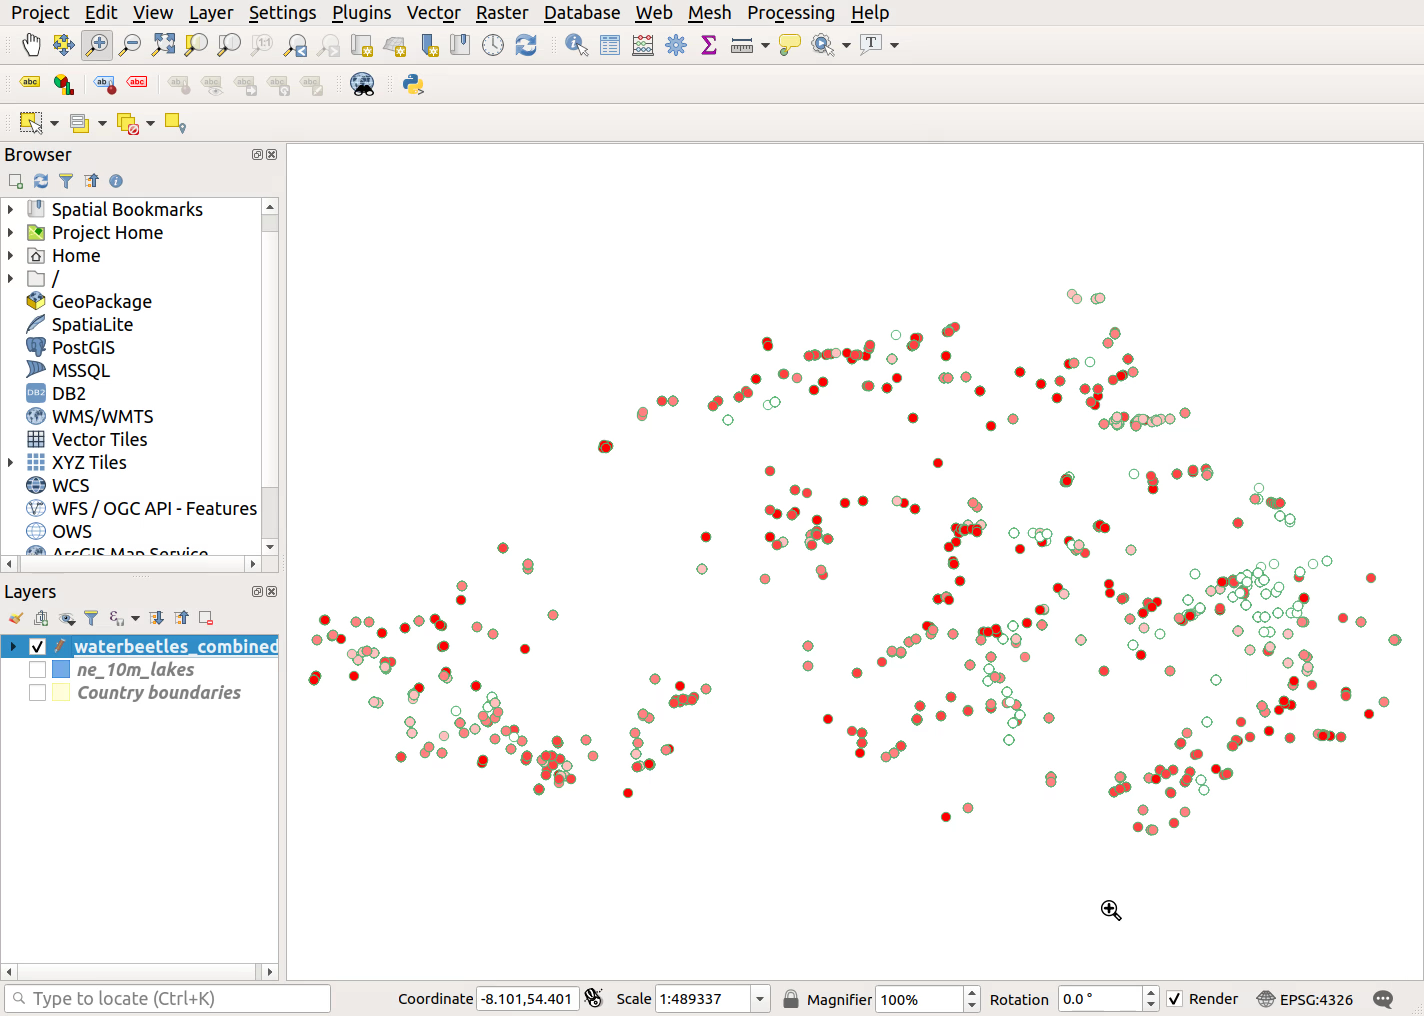
- Note the distribution of records. Those of you who know Northern Ireland will see that many of the older records are clustered around Belfast
Previous submodule:
Calculate a new field