Communicate location on your map
To help readers understand what part of the world your map shows, you need to include components to indicate location:
- Grid or graticule showing x,y coordinates, plus a text box with SRS information so coordinates can be interpreted
- Optional inset map, to place your area of interest into its wider geographical context, e.g. national boundaries or river/mountain systems familiar to your intended audience
Gridlines or tickmarks (crosses that show where x and y gridlines intersect) should be sufficiently close to allow 2-4 lines/intersections both horizontally and vertically, but not so dense that they distract from the map’s message
![]() To help you determine the appropriate spacing for your gridlines, move your mouse across your main QGIS map window whilst watching how the coordinates at the bottom of the window change. Note down the min/max coordinates, and decide a spacing that will allow you to include 2-4 lines along x and y dimensions, ideally using the same spacing for both vertical and horizontal gridlines
To help you determine the appropriate spacing for your gridlines, move your mouse across your main QGIS map window whilst watching how the coordinates at the bottom of the window change. Note down the min/max coordinates, and decide a spacing that will allow you to include 2-4 lines along x and y dimensions, ideally using the same spacing for both vertical and horizontal gridlines
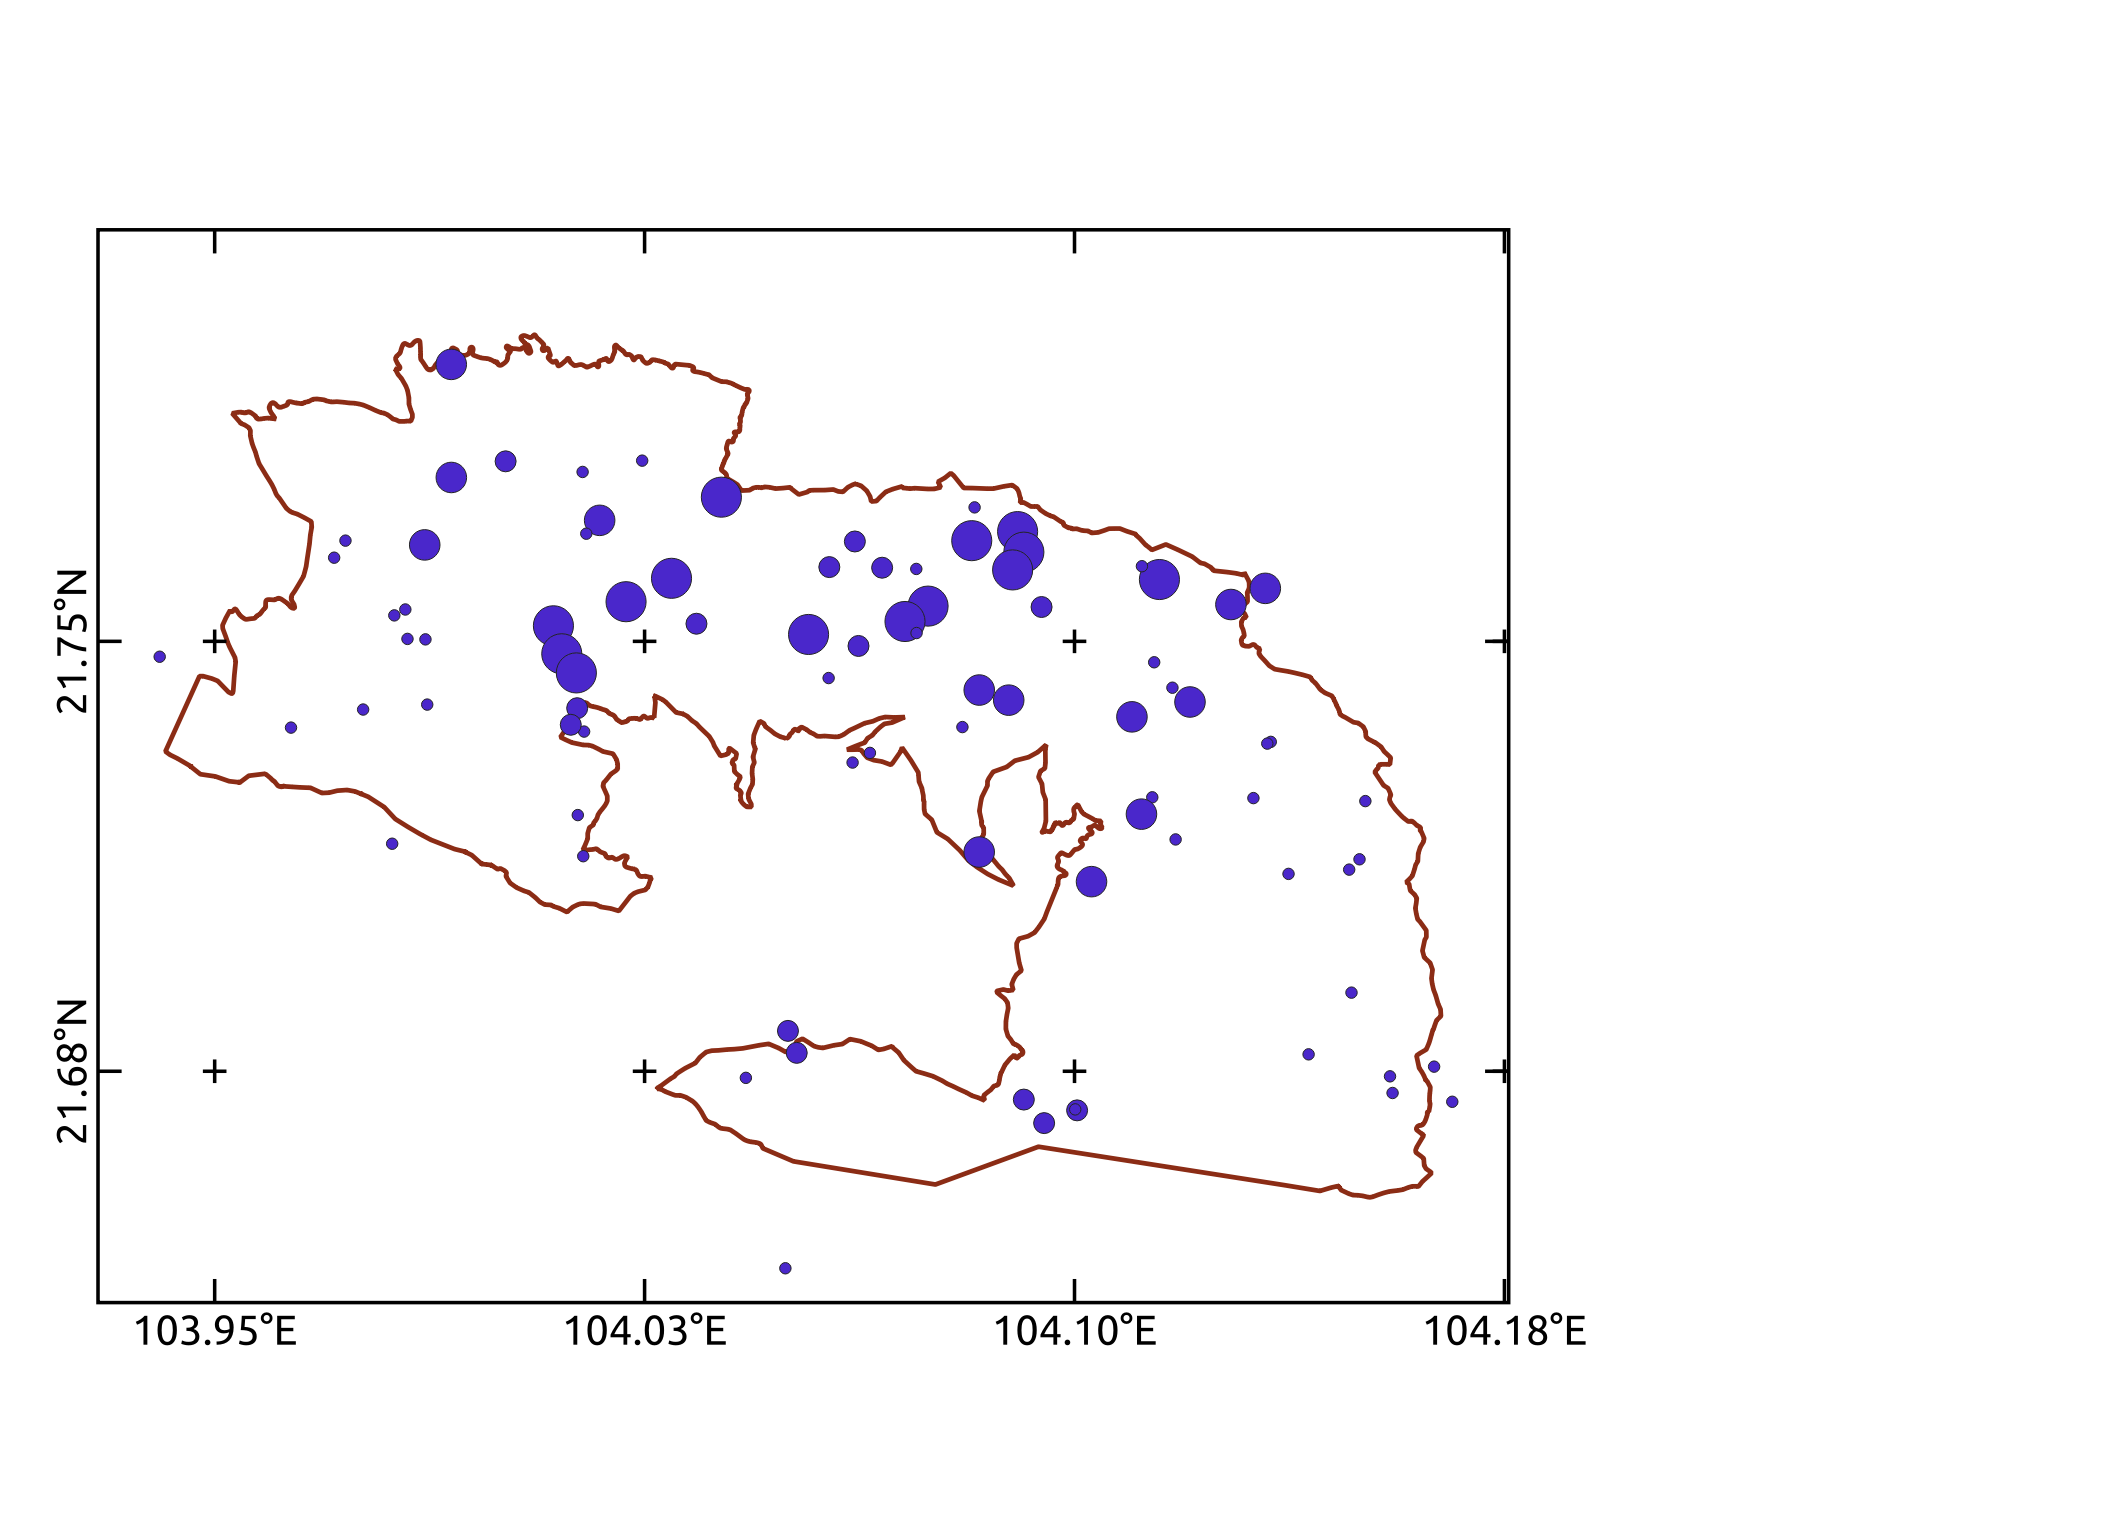
By the end of this exercise, your map will look something like this:
Add a grid
- Save your QGIS project - we explain why below, but it’s generally a good idea to save after every step in your project
- Click on your map component and select the
Item Propertiestab on the right if it’s not already visible- Scroll down and expand the
Gridssection- Add a new grid by clicking on the green
+button- Click on the
Modify Grid...button
- Choose your grid type - we recommend Solid (lines) or Cross (tickmarks). You can adjust the line or cross width in the detailed settings
- Select the
CRS- it’s a good idea as a beginner to explicitly select the SRS you want to use for your grid, to help solidify your understanding of the practical consequences of your choice of SRS when preparing maps. In our example, we use Latitude-Longitude (EPSG:4326 - WGS84)- Enter a suitable
Intervalfor your gridlines or tickmarks. For a map showing the entire Che Tao Nature Reserve, using a Latitude-Longitude grid, we suggest intervals of 0.05 or 0.075 (this is in degrees). If you’re working with a projected SRS then your intervals will be in the 1000s (km), 10,000s (10km) or even 100,000s (100km) for maps with very large geographic extentsSetting grid intervals is the most likely point you’ll make an error which could delay your progress. Setting an interval in the wrong units of measurement, such as 0.05m when you thought you were working in degrees, forces QGIS to attempt to draw thousands of gridlines across your map, and it will probably crash! This is why we suggest saving your project before adding a grid
- Select a
Frame style- we suggest Interior ticks.Combining these with the map frame you added on the previous page gives you the most flexibility in how your grid appears
- Tick the checkbox beside
Draw Coordinates. Choose a format (we suggest Decimal with Suffix for Latitude-Longitude) and decide on which sides of your frame you want them drawn
![]() The best way to understand these detailed settings, and the impact of your choices, is to experiment with different settings until you find a design that you like. Play with the
The best way to understand these detailed settings, and the impact of your choices, is to experiment with different settings until you find a design that you like. Play with the Frame and Draw Coordinates settings. If you want a real challenge to test your understanding, add a second grid so that you have one for your chosed projected SRS, and one for Latitude-Longitude
Add an inset map
We only provide instructions to add a grid on this course, but if you’re more confident using QGIS, you are welcome to try adding an inset map yourself. An inset map can show a box indicating the geographic extent of the main map, or a layer from the main map that would still be identifiable if zoomed out (e.g. Che Tao Nature Reserve boundary)
![]() Hints:
Hints:
- Add a second, smaller map to your canvas
- Edit its extents manually to display a larger geographic area, or Zoom out in the main QGIS window. You can use bookmarks to help you switch between the two extents
- Adjust which layers are visible in your main QGIS window. Can you figure out how to create a box or polygon indicating the extent of your map?
- Lock the layers in both of your maps