Symbolise layers by attributes
Before we actually make our map, let’s equip ourselves with some extra skills for symbolising layers
So far we’ve ignored information in the attributes table of vector layers, and used identical symbology for all features in a layer. Now it’s time to explore a powerful visualisation option in QGIS ![]() - the ability to symbolise features by attributes. For vector layers, symbols are drawn according to properties (columns) in their attributes table. For raster layers, symbols depend on the value within each grid cell
- the ability to symbolise features by attributes. For vector layers, symbols are drawn according to properties (columns) in their attributes table. For raster layers, symbols depend on the value within each grid cell
![]() For all of these instructions you need to have the
For all of these instructions you need to have the Layer Properties window open on the Symbology tab
![]() Be aware that the layers in the screenshots below are different from those in our gibbon case study
Be aware that the layers in the screenshots below are different from those in our gibbon case study
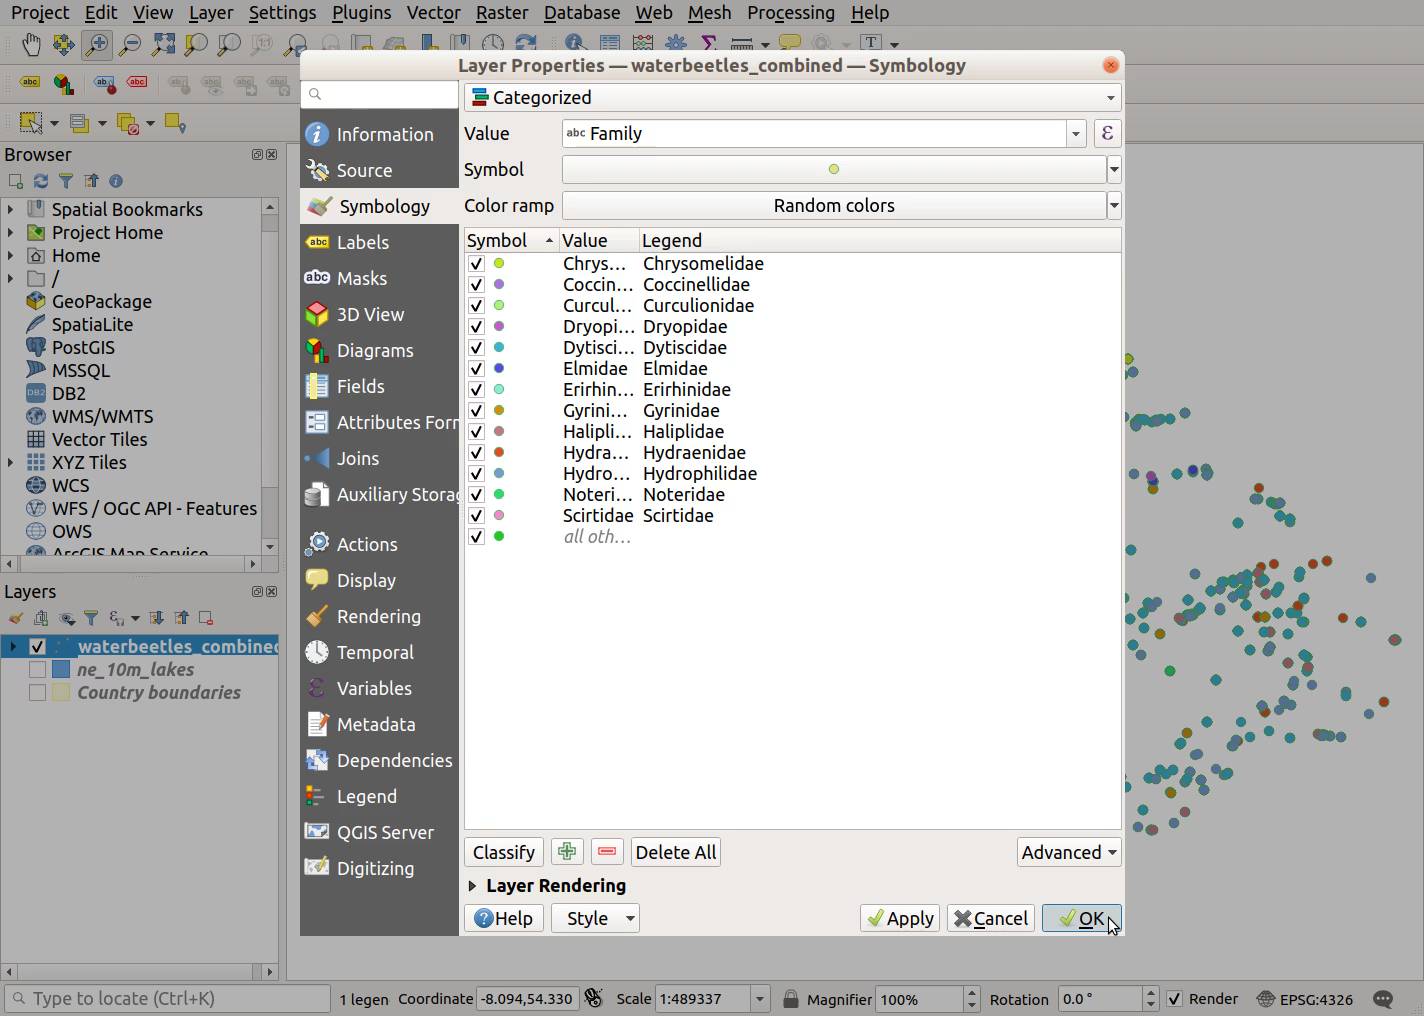
Visualise categorical attributes
For vector layers ![]()
- Select
Categorizedfrom the dropdown menu at the top (the default isSingle Symbol)- Choose the column you want to symbolise from the
Valuedropdown menu; for example ThreatType from the ThreatEvidence layer- Click on the
Classifybutton in the bottom left- Click
ApplyandOKto finish
For thematic raster layers ![]()
- Ensure
Render typeis Paletted/Unique values- Double click on the
ColororLabelto manually edit the colour or label of each pixel value in your
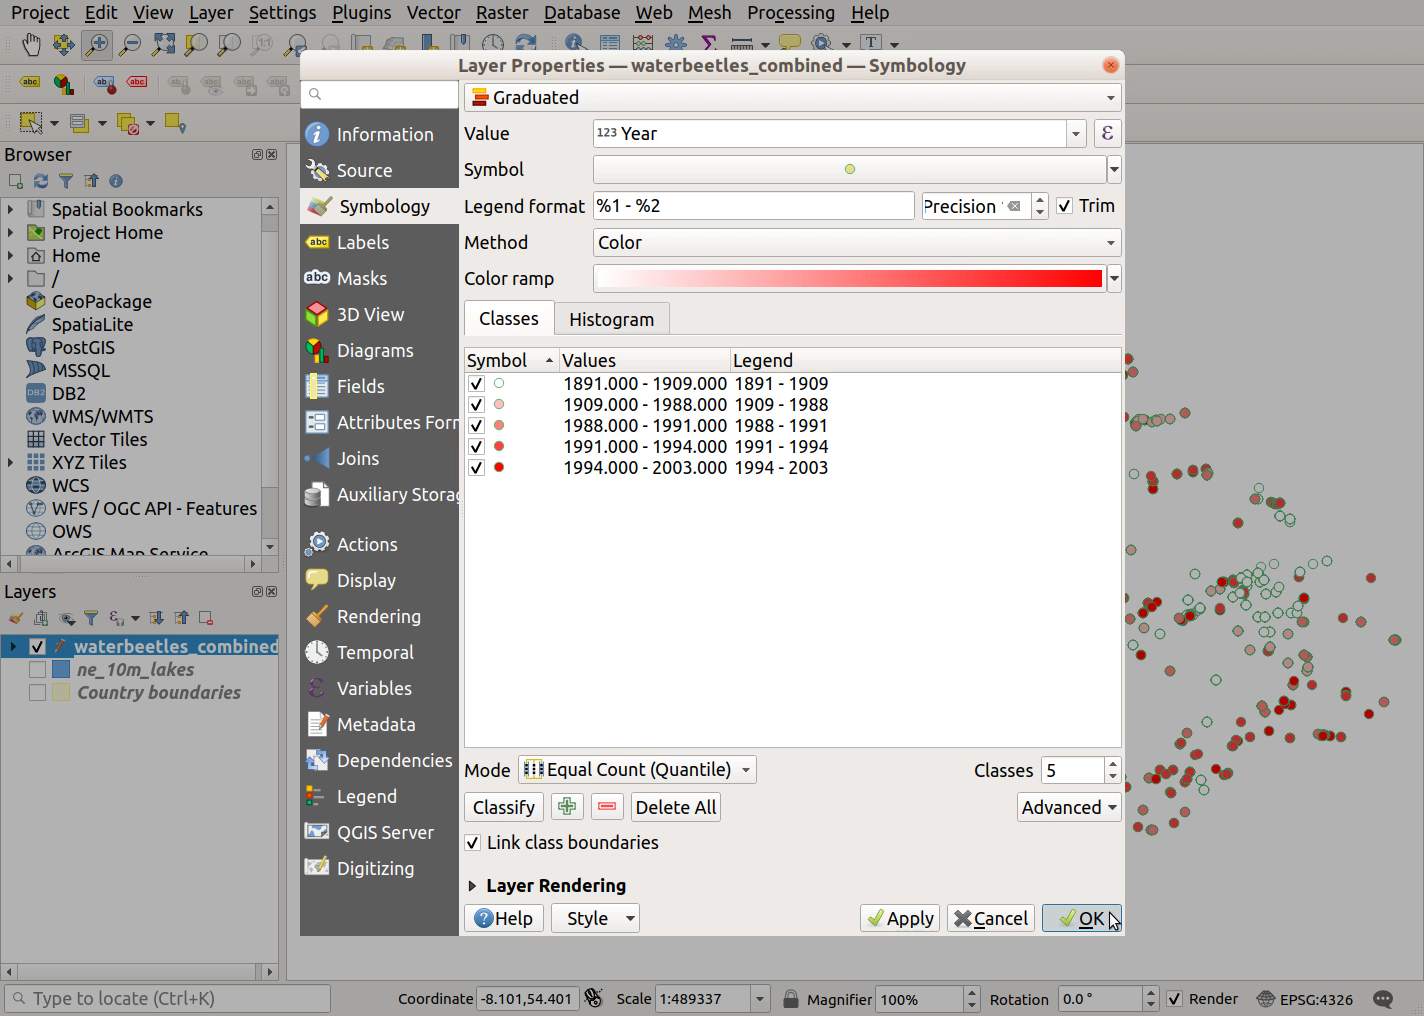
Visualise continuous attributes
For vector layers ![]()
- Select
Graduatedfrom the dropdown menu at the top- Choose the column you want to symbolise from the
Valuedropdown menu; for example GroupSize in one of the GibbonSightings layers- Click on the
Classifybutton in the bottom left- Click
ApplyandOKto finish
For continuous raster layers ![]()
We don’t have an example of a continuous raster layer in the gibbon case study, but a DEM would be one example. These instructions are included for completeness, to help those working with their own data
- Under
Render Type, select Single band gray or Single band pseudocolor- Click Classify to see the result of the default settings
- Experiment with the settings e.g.
Interpolation,Color rampandModeuntil you’re happy with the result
Adjust layer transparency
It can be useful to make layers partially transparent, particularly if you want to reduce the visual impact of thematic raster layers, or allow layers such as a hillshade/terrain to be faintly visible without dominating your map
For vector layers ![]()
- On the
Symbologytab, click on the triangle besideLayer renderingto expand that section- Adjust the
Opacityto below 100% (e.g. 60%) and clickApplyto see the result
For raster layers ![]()
- Switch to the
Transparencytab- Adjust
Global opacityto below 100% (e.g. 60%) and clickApplyto see the result