Vector data model
The vector data model is best for modeling discrete objects which have clearly defined boundaries and can be counted
Examples of vector features:
- Coral reefs

- Point sources of pollution

- Individual trees or patches of wetland

- Animal movement tracks from GPS collars

- Areas affected by fire or clear-felling

Vector data come in three spatial forms: point, line and polygon. Each vector feature can have multiple attributes
- Points
- One-dimensional feature with a single x and y coordinate (vertex) This example contains 3 points
- Lines
- Linear two dimensional feature composed of a series of x and y coordinates (vertices)
This example contains a single line made from 4 vertices
- Polygons
- Two dimensional feature composed of sequence of x and y coordinates (vertices) where the first and last vertex are identical, creating a closed area
This example contains a single polygon made from 9 vertices
- Vector attributes
- Information about a feature or record, stored in columns in the attributes table
Quiz: Vector data model
Test your new knowledge with our mini quiz! ![]()
Adjust vector symbology
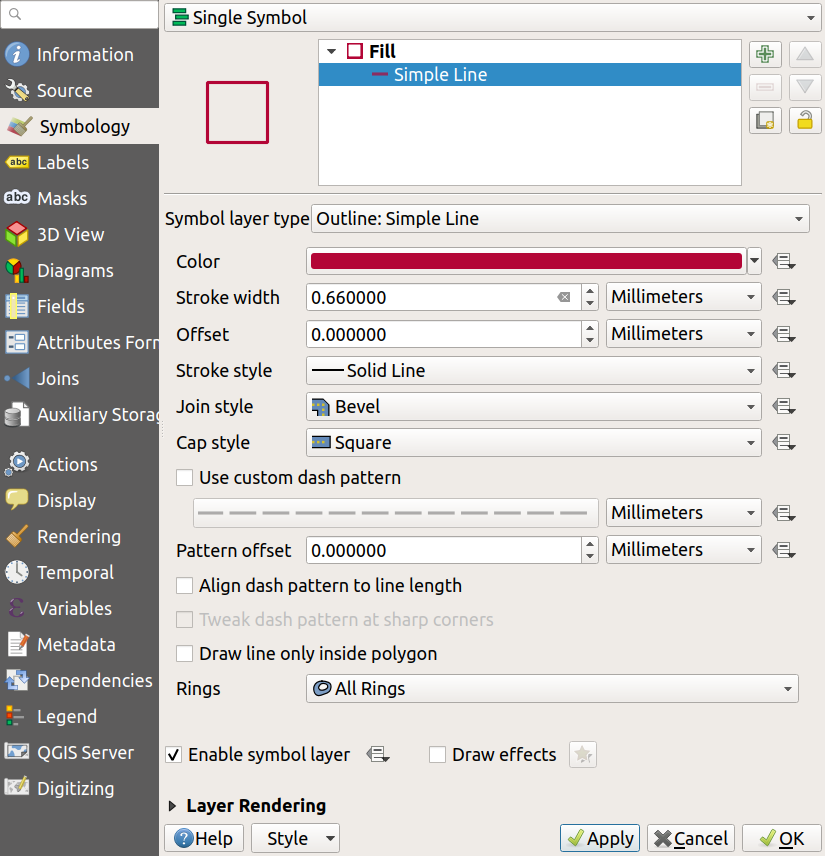
Let’s work with a vector layer in QGIS, and adjust the way the gibbon distribution polygons are displayed
- Double-click on NomascusConcolor_Distribution in the
Layers panelto open the Layer Properties pop-up window- Select
Symbologyfrom the left-hand menu- At the top, under where it says ‘Fill’, click on
Simple Fill- Click on the
Symbol layer typedropdown just below and selectOutline: Simple Line- Click
Applyto see the effect - your polygons should now be drawn as an outline only, with no fill colour- Adjust the
Color,Stroke widthandStroke styleto see the effect of these settings

Previous submodule:
Represent the world
Next submodule:
Raster
